
This is part four of a beginner-level series about Unity, aimed at existing .NET business developers, who are interested in dipping a toe into something different.
In Part 1 - Getting started, we explore how a business developer could make a start using Unity, look at the Editor and overview some of the common words that you’ll encounter.
In Part 2 - Scripting, we learn about some coding concepts that are applicable to Unity.
In Part 3 - A prototype mobile app, we work through the steps needed to make a super-simple application and deploy it to a mobile device.
In Part 4 -Logging and debugging with Android , we look at how we can attach the debugger and use logging - basic tools for any developer.
In Part 5 - Unity UI 101 , we take a first look at Unity UI and interact with a basic button control.
In Part 6 - Unity UI Scrolling List - Creating the Scene , we take on a slightly more complex project, by creating a scrolling list of items using Unity UI.
In Part 7 - Unity UI Scrolling List - Adding the Code , we finish the project started in Part 6, by writing a script to call a REST service and populate items in our UI.
Overview
The need to see what our code is doing is a fundamental requirement for any developer and using a debugger is usually a primary tool during project development.
In this article, we’ll be looking at how Unity handles exceptions, how to use the Unity debugger and finally how to make use of logging on an Android device.
As a reminder, this series is not intended to be an in-depth beginner guide to Unity. Instead, this is meant to be a birds-eye overview, orientated towards existing business developers. You’ll probably be the sort of person who already has a good feel for how software is created, but just wants an overview of the main features and semantics of how a Unity project hangs-together.
We’ll be re-using the “BasicPhoneApp” project that we created in the previous article, so if you haven’t already been following along, you should refer back to Part 3 - A prototype mobile app
Working with exceptions - Unity Editor error pause
In Part 2 - Scripting, we talked about how Unity doesn’t stop when an exception is thrown. This can make design-time debugging more difficult.
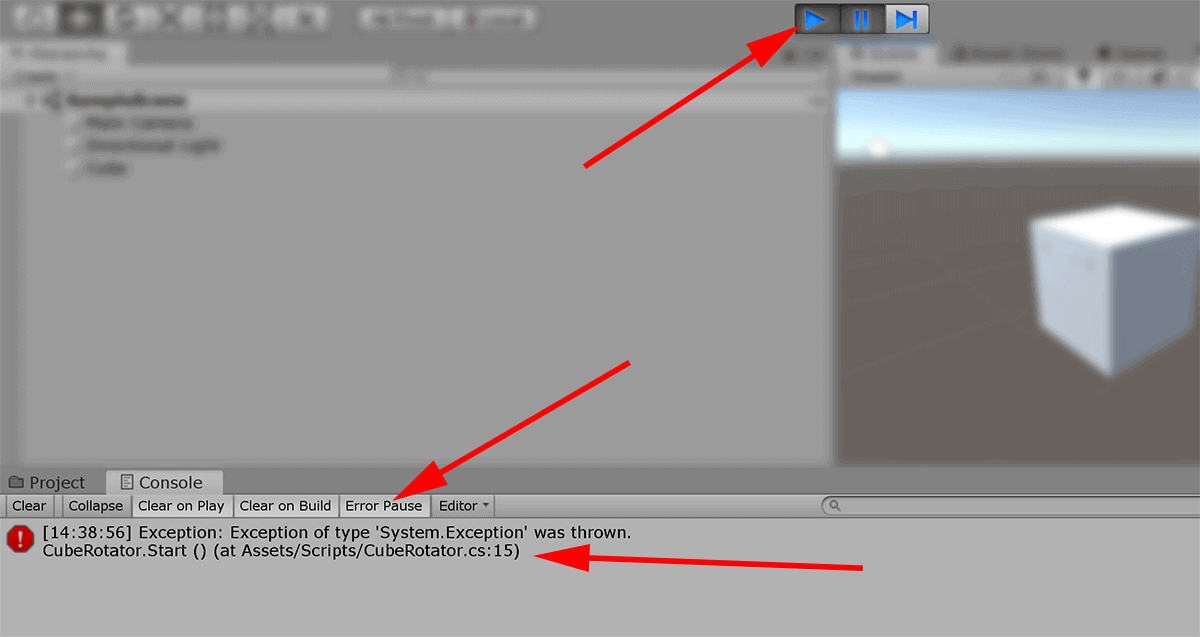
It’s therefore useful to know that in the Unity Editor console, there is a toggle button “Error Pause”. This simply pauses the code when an Exception is thrown.
To clarify, exceptions will always show in the Unity Editor console window … but by enabling this toggle, we can stop the game from running, the moment a problem shows up.This is particularly useful if a problem is situation-specific and only appears after some time, etc.
This feature is unrelated to the presence of a code editor and/or attached debugger.
To demonstrate this in action, add the following code to our demo project to artificially provoke a an error:
void Start()
{
    ourCubeObject = GameObject.Find("/Cube");
    throw new System.Exception();
}
Using a debugger
A majority of the time, we can run our projects locally using the Unity Editor directly.
Attaching a debugger, running in an IDE such as Visual Studio, is almost identical to the debugging experience that we are probably already familiar with.
However, for certain applications - notably with Augmented Reality apps with their reliance on hardware sensors - we have no choice but to deploy and test our application directly on a mobile device.
Getting our project deployed and accessible for debugging on a mobile device requires us to go through a number of additional steps, which we’ll look at later in this article.
Something worth mentioning is Unity Remote. This is a solution for testing projects targeted at mobile devices and uses a companion app published by Unity.
Instead of the lengthy process of deploying a project to a device, it can instead be run on the host computer and the graphics streamed as a live video to the App. Similarly, this also allows the hardware inputs, on the device, to be used remotely (touch, tilt, cameras etc).
We can learn more at Unity Docs : Unity Remote 5.
Before we start
To attach a debugger to Unity, we may need to install extensions to our IDE of choice:
- MS Visual Studio. Click “Extensions” → “Manage Extensions” → “Online”. Search for and install the “Visual Studio 2019 Tools For Unity” (at time of writing) extension.
MS Visual Studio For Mac. According to Microsoft Documentation - Visual Studio for Mac Tools for Unity, support for Unity is included out of the box.
Jetbrains Rider. As clarified in Jetbrains Documentation - Getting Started with Rider and Unity , support for Unity is included out of the box, which is convenient.
MS Visual Studio Code. According to Microsoft Documentation -Unity Development with VS Code , support for Unity requires a selection of extensions to be installed (including C# language support). Primarily we need to add the VSC Debugger for Unity
In this article, we’ll be demonstrating by using Visual Studio 2019 Community (for Windows)
- We can read more at Unity Manual - Debugging C# code in Unity
Debugging projects running locally in the Unity editor
Let’s start by attaching the debugger to a game running directly in the Unity Editor
- Start by ensuring that the Unity Editor is in regular “edit mode” and not “play mode”
- Switch over to your IDE and drop breakpoints in the code (putting one at the beginning of the
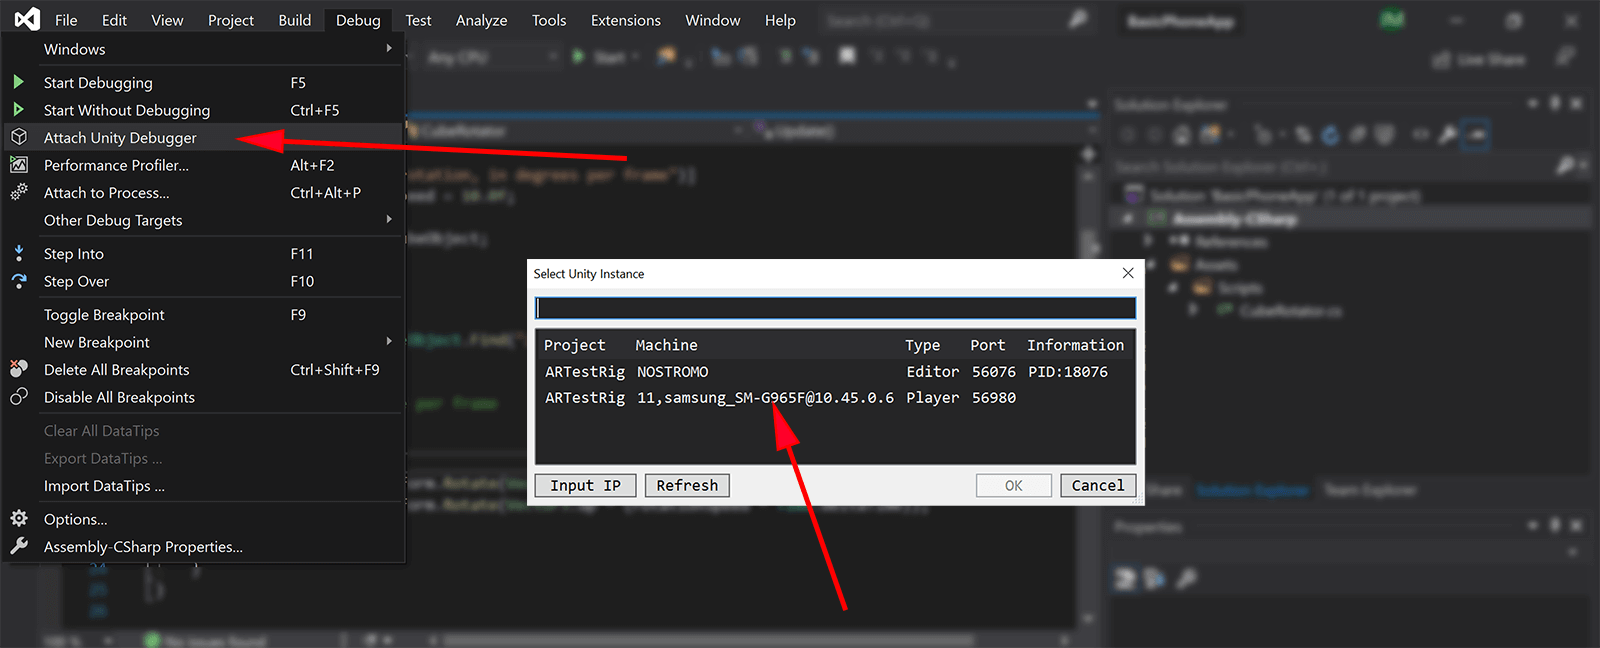
Start()method would be good). - In the IDE, select “Debug” → “Attach Unity Debugger”
- A popup will appear titled “Select Unity Instance”
- At this point in the project, we would expect only a single instance to show - specifically we expect it to be of type editor.
- Go ahead and select this instance and click “Ok”
- Switch back to Unity Editor and press “play” to start the project.
Tip: We can attach the debugger to a running project if we like, but we will, of course, miss the opportunity to debug any code run at project startup.

Debugging a project deployed remotely to an Android device
We can attach the Unity debugger to an application running on a mobile device. In principle the debugger can work either:
- over a wired connection (usb/lightning)
- untethered using WiFi (although there is a performance compromise)
Prepare Android device for deployment
First of all, we need to make sure that our mobile device is ready to be debugged:
- If you haven’t already followed the steps from part 2, you should unlock developer mode.
- Start by ensuring our data cable is disconnected
- On our Android device, go to the “Settings” app.
- Select “Developer Options”
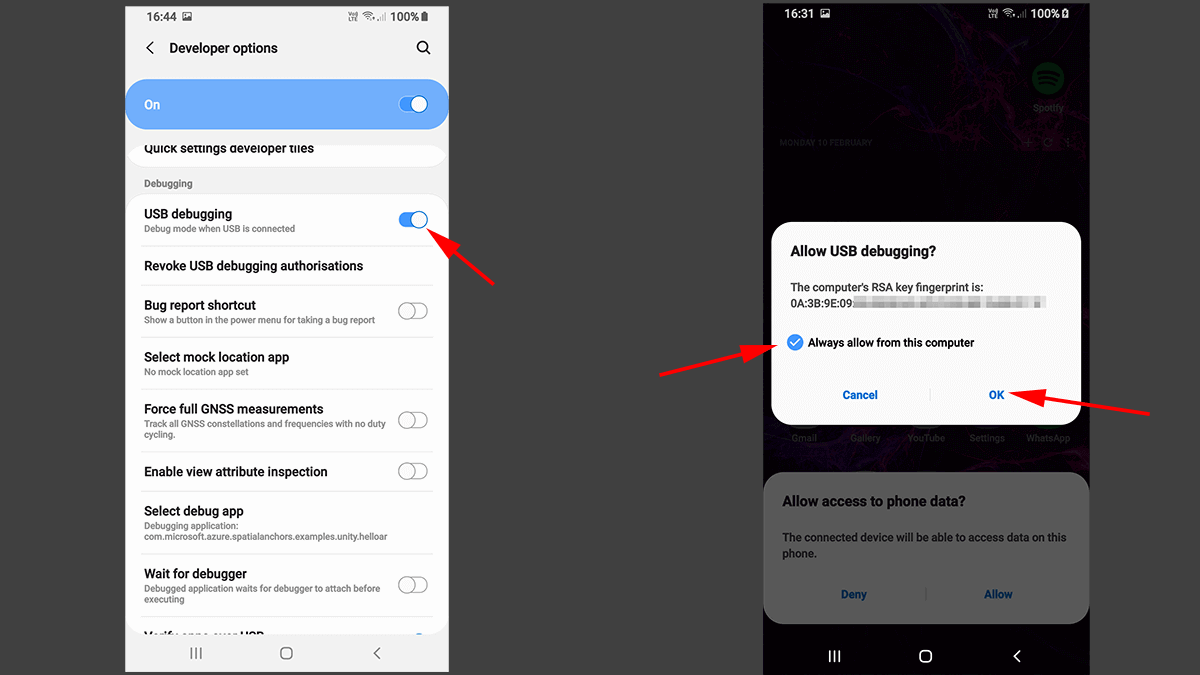
- Enable “USB debugging” option.
- Connect our data cable between device and PC.
- Our device should prompt us for confirmation as to whether to trust the connected PC to allow USB debugging. We should accept this.
- For convenience, we should also select the option to “always allow from this computer”
Deploy a debug build to device
Just like in other .NET projects, Unity projects can be built with “Release” and “Debug” versions.
- If you are not familiar with the difference between “Release” and “Debug” versions, you can learn more at Microsoft Documentation : Set debug and release configurations in Visual Studio
If we want to be able to debug a running app on our device, we need to deploy a version of the app build in “Debug” mode:
- In Unity Editor, go “File” → “Build Settings”.
- Select the “Android” tab if not already selected.
- In the “Build Options”, check “development build”, followed by “script debugging” and “wait for managed debugger”
- Incidentally, in the “Android developer options” on our device, there is also an option for “wait for debugger” if we prefer that way instead.
- Check that our device is connected to the computer with the USB cable.
- Go ahead and deploy to the device.
- Stand up and do some stretches; build and deployments are always slooooooow.
- When the Unity project has started up on our device, it will now prompt us with “You can attach a managed debugger now if you want” message.
Gotcha: When using one on my computers, I had problems attaching a debugger because, depending on the project, the remote instance would sometimes not show (only the local editor instance). I spent days on the problem and never managed to get to the bottom of it. You can read that experience here I got stuck - How I approached a problem [Couldn’t attach Unity debugger to my Android App]
We should now be able to:
- start our app running on the mobile device
- wait for the app to prompt us to connect a debugger
- In Visual Studio, select the option to attach the Unity debugger (just as described above, when connecting to Unity Editor).
- if things are working correctly, we should be presented with two options:
- connect to the USB device or,
- connect to the WiFi device (typically the one showing the internal-network IP address is the WiFi device)
Missing remote instance when trying to attach debugger? - How to fix.
Blog Update 25 Aug 2021: Roughly a year and half after I originally published this article, I once again found myself stuck with the problem of the remote instance not being listed in Visual Studio. This time I stumbled on a VS configuration setting - which seems to be the fix! This is a popular blog, so I've updated it with this new section - I'm sure there will be tonnes of people who will appreciate the update!.
The problem that thwarted me originally, was that Visual Studio would sometimes not show the remote Android instance in the “Select Unity Instance” dialogue.
I’m fairly certain this is a VS bug, but the issue ultimately relates to the fact that VS doesn’t seem to reliably detect and use the same Android SDK that your Unity project is using. I’d speculate that what’s going on, is that it’s failing silently - which is why it doesn’t list the remote device.
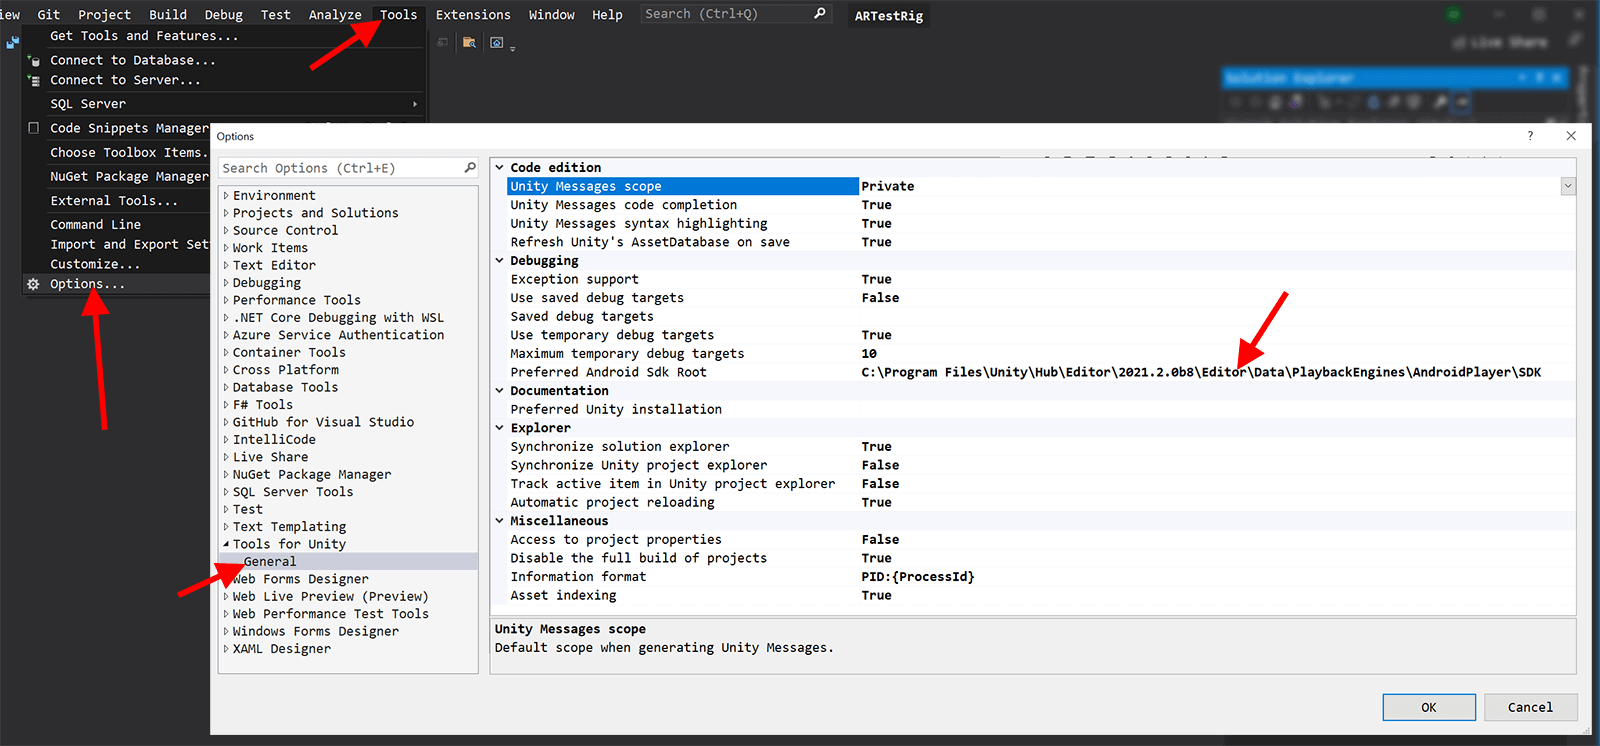
Fortunately, once we know what the problem is, the fix is really easy. In Visual Studio, edit the following settings:
Tools➝Options➝Tools for UnityDebugging(section)- Set “Preferred Android Sdk Root” appropriately for your project.
- You’ll need to locate the Unity installation your project is using (noting you may have multiple version installed) and specifically the
AndroidPlayer\SDKfolder. For example, my installation was as follows : C:\Program Files\Unity\Hub\Editor\2021.2.0b8\Editor\Data\PlaybackEngines\AndroidPlayer\SDK
- You’ll need to locate the Unity installation your project is using (noting you may have multiple version installed) and specifically the
- Return to the
Debug➝ Attach Unity Debugger` to check if it works. - For me, the result was immediate and the remote instance became listed on the first attempt - but try restarting VS or your Android app if you don’t see an immediate result.
How to use Logging in Unity
In Unity, a logging library is included out-of-the-box as part of the Unity Engine.
Unlike other .NET implementations (such as .NET Core) we don’t need to register a logging provider specifically.
- We can read more at Unity Documentation - Debug.Log
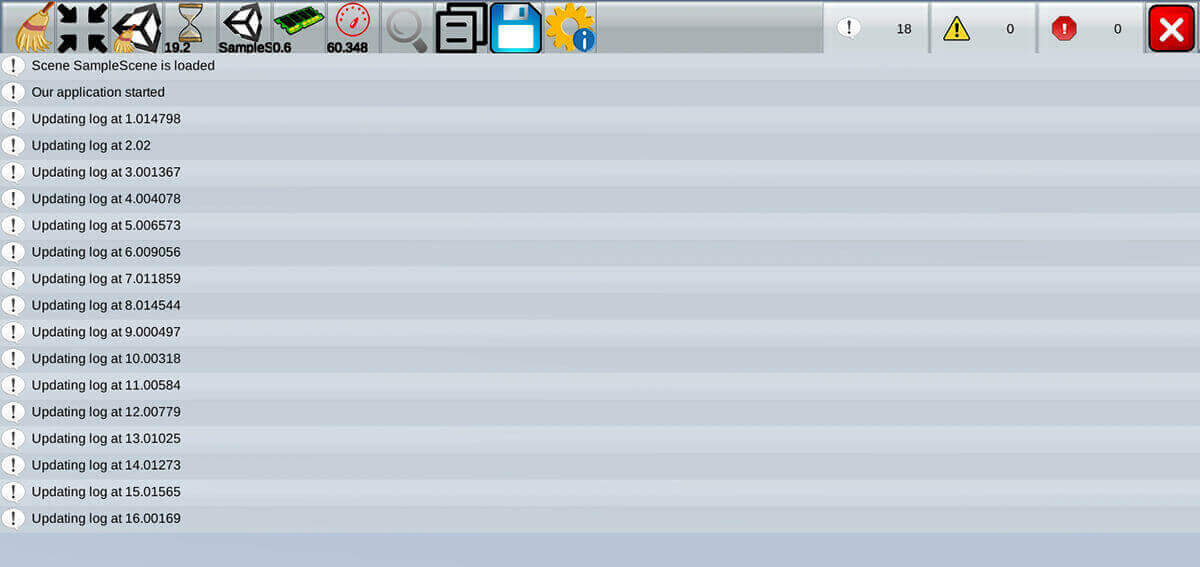
To demonstrate logging in action, modify the code in our demo project. These changes will log the message “Updating log at xxxxx” - every second - and will give us something easy to look out for:
void Start()
{
ourCubeObject = GameObject.Find("/Cube");
//throw new System.Exception();
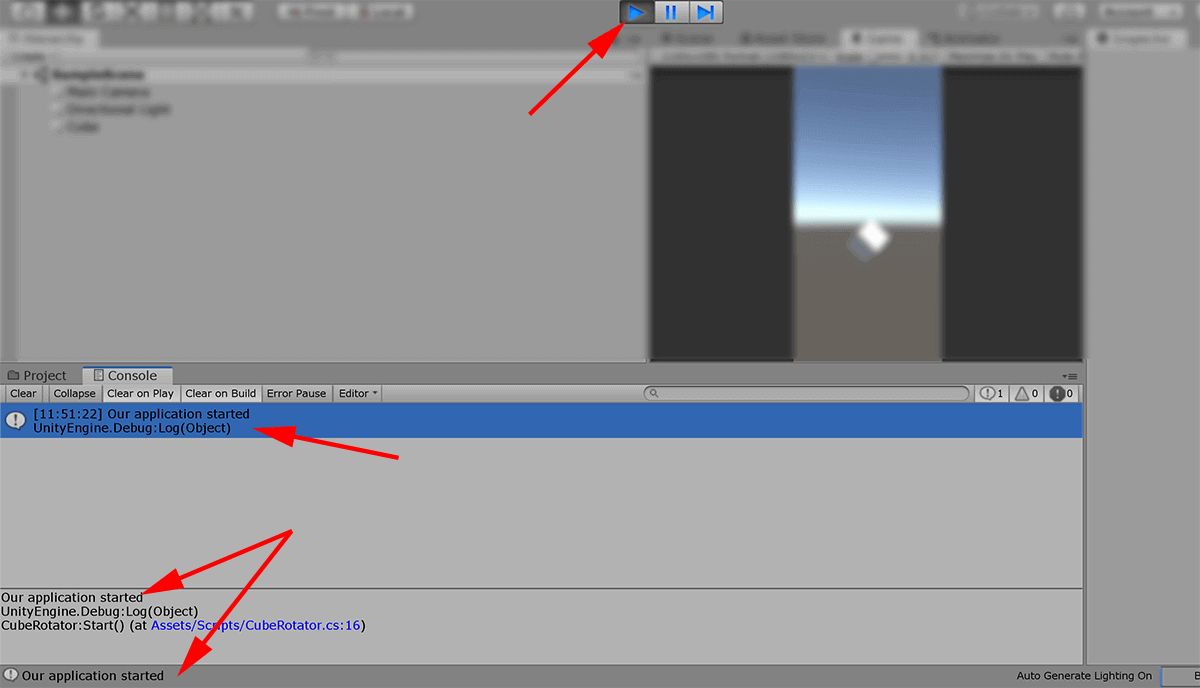
Debug.Log("Our application started");
InvokeRepeating("RepeatingLogMessage", 1f, 1f); //1s starting delay, then repeat every 1s
}
void RepeatingLogMessage()
{
Debug.Log($"Updating log at {Time.time}");
}
- Run the project from the Unity Editor.
- Logging information will be displayed in the Console Window.
Unity Editor Log files
By default, Unity saves a rolling copy of the log into our AppData folder e.g. C:\Users\jimmc\AppData\Local\Unity\Editor
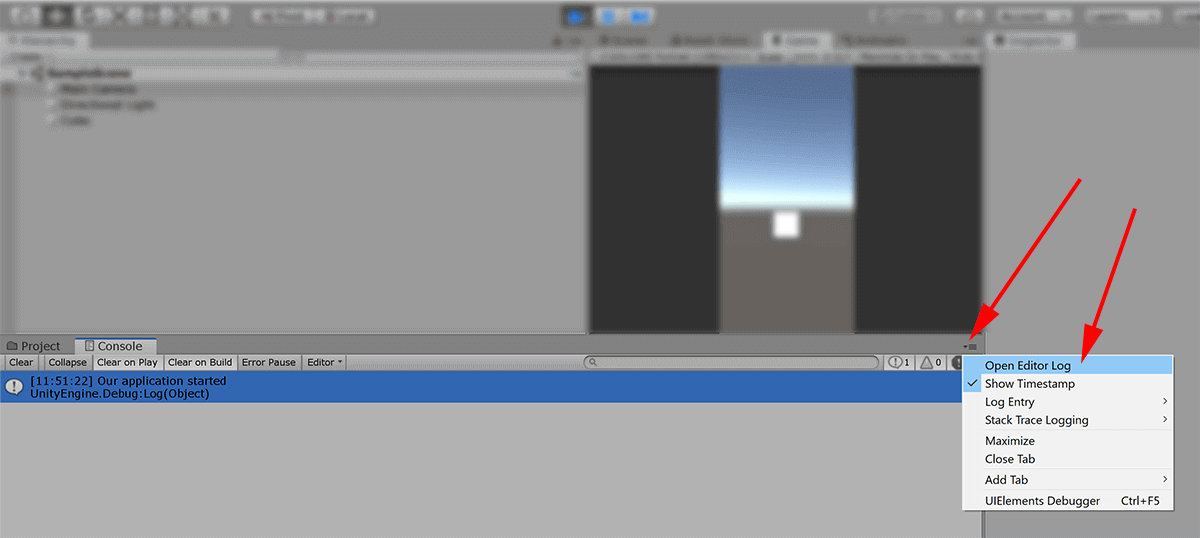
A useful shortcut to this log can be found in the Unity Editor.
- In the “Console Window”, click the small menu option button in the top-right corner.
- Select “Open Editor Log”
Logging using ADB LogCat
Arguably the most basic mechanism to access the Android log stream is the command line utility “ADB.exe” (Android Debug Bridge).
- ADB is one of several tools supplied as part of the Android SDK
- ADB is used to issue commands related to development and debugging.
- It provides the “bridge” between the mobile device and our development/debugging application.
- We can use it to do things such as deploying application packages.
- When we installed Android support for Unity, we should also have installed the Android SDK - therefore we should already have this tool installed on our computer.
- The exact location will depend on our installation folders and the exact version(s) of Unity we have installed. Be prepared to dig through a very long folder structure to find it!
- An example of the folder location on my computer is:
C:\Program Files\Unity\Hub\Editor\2019.2.17f1\Editor\Data\PlaybackEngines\AndroidPlayer\SDK\platform-tools
- An example of the folder location on my computer is:
- We can read in-depth guides about ADB, here:
- Android Developer : Android Debug Bridge (ADB) . This is a really useful and thorough resource.
- xda-developers: what is adb. Look to the bottom of that article for a large list of things we can use ADB for.
Now that we know a little more about ADB, we should know that it provides us with a command called “Logcat” that is used to output the log stream to the console.
- We could just type
adb logcat- but you’ll get a headache very quickly ;-) - Instead, we should apply filters to make the stream manageable. - Try something like
adb logcat Unity:D *:S- The part of the above command
Unity:Dinstructs the viewer to show “anything with the tag ‘Unity’ with a priority of ‘Debug’ or higher”. - It’s slightly unintuitive, but we also need to include the command
*:S- this is a catch-all/wildcard that instructs the viewer to “set everything else to ‘silent’”.
- The part of the above command
- We can learn more about the command line syntax for using Logcat here Android developers : Logcat command-line tool
Logging on remote device with Unity Asset Store Plugin “Log Viewer”
This is a nice little utility that runs directly on the mobile device and doesn’t require us to be tethered. The asset is free to use.
- Go to the Unity Asset Store and search for “Log Viewer” by “dreammakersgroup”. This is a direct link to the website.
- In Unity, import the asset into our project.
- With the asset installed, the Unity Editor will now have a new menu item “Reporter” - click this item and select “Create”
- This will create a new GameObject in our scene called “Reporter”
- This is literally all of the installation and configuration that’s needed!
- Rebuild and deploy the project to the device.

- With the project running on the device, use your finger to draw a circle on the screen (clockwise or counter-clockwise, it doesn’t matter).
- Our project will now display logging output directly on the device!
Logging on remote device with Android Device Monitor
If you’re not a fan of wrestling with the command line, the “Android Device Monitor” is an older tool that has now been deprecated, but we may still find it useful.
This approach requires us to be tethered to our device via a USB cable - but does give us powerful tools for viewing and filtering logs.
We can read more at Android Developers : Android Device Monitor
We will need to enable our phone for “USB debugging”.
- If you’ve been following along, you will have done all of the necessary steps already.
When we installed Android support for Unity, we should also have installed the Android SDK - therefore we should already have this tool installed on our computer.
- The exact location will depend on our installation folders and the exact version(s) of Unity we have installed. Be prepared to dig through a very long folder structure to find it!
- An example of the folder location on my computer is:
C:\Program Files\Unity\Hub\Editor\2019.2.17f1\Editor\Data\PlaybackEngines\AndroidPlayer\SDK\tools
At this point, we should be able to just run the monitor.bat batch file to start the “Android Device Monitor”, which should call the appropriate x86 or x64 executable.
This didn’t work out-of-the-box for me, so I had to jump through some extra hoops to get this working:
- When I tested this out, the batch file
monitor.batcouldn’t figure out the correct path, so I located the version ofmonitor.exemanually. On my system, I used....\SDK\tools\lib\monitor-x86_64
Annoyingly, trying to run this program directly, still didn’t work for me on my computer. This was because I hadn’t previously installed Java (and specifically, even though the java virtual machine executable was installed on the disk, it wasn’t specified in the system path).
To rectify this problem, I needed to add javaw.exe to the system path.
- Using explorer, locate the file
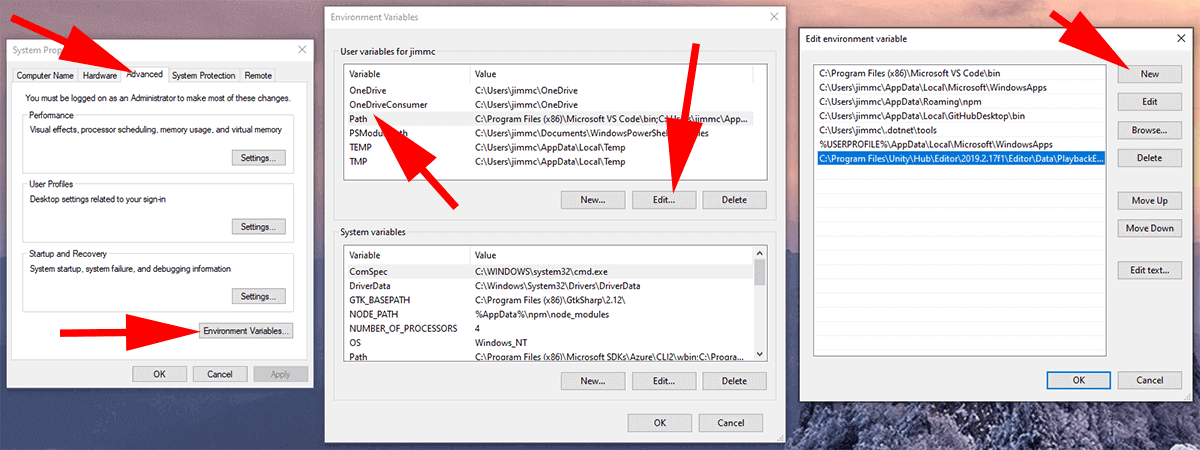
javaw.exeon our computer. The exact location will depend on where we’ve installed our files and which version of Unity we have installed, but an example of the file location on my computer is:C:\Program Files\Unity\Hub\Editor\2019.2.17f1\Editor\Data\PlaybackEngines\AndroidPlayer\Tools\OpenJDK\Windows\bin - Highlight the path and use ctrl-c to copy it all.
- In Windows, open up “System Properties”
- Select the “Advanced” tab and click the “Environmental Properties”
- Highlight the “Path” environment variable and select “Edit”
- Click “New” (for new path) and paste in the path that we copied earlier.
- Ok the changes
- Run “Android Device Manager”
- If it isn’t connected already, connect the mobile device using USB.
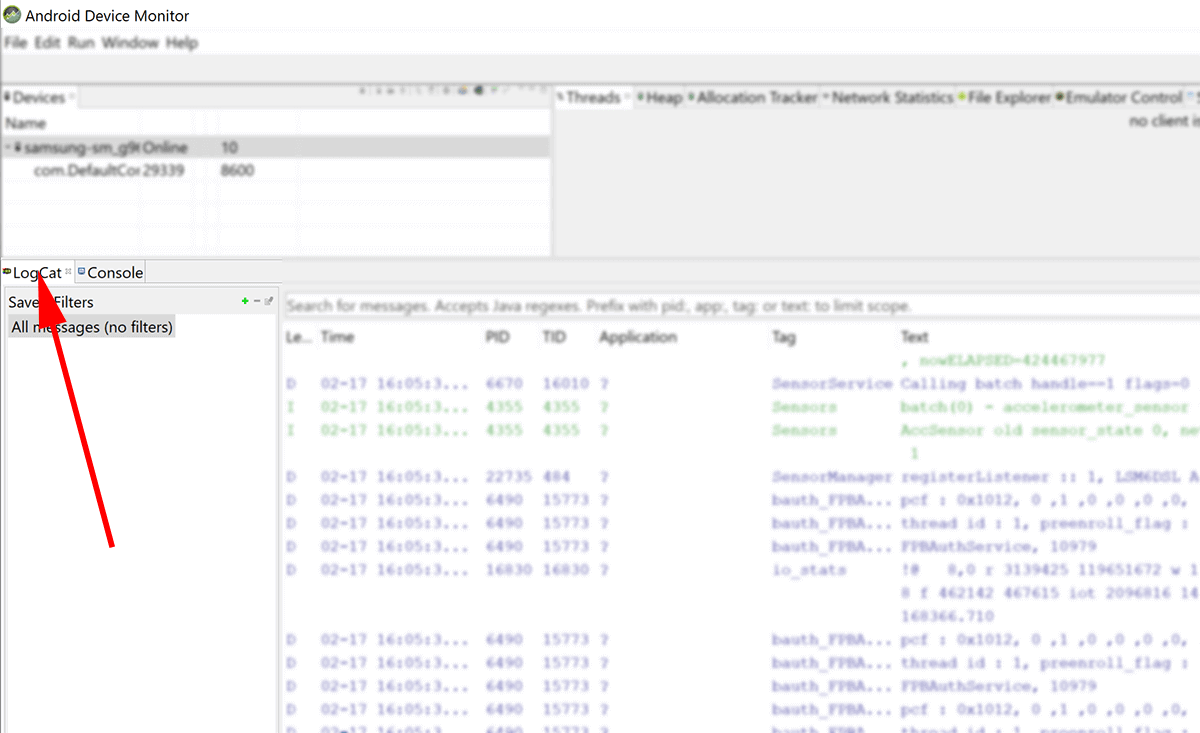
- Locate and press the “LogCat” tab.
- Re-arrange the windows to better see the log stream.
- We should be seeing a stream of all events currently being raised on our device (expect to see a fast-moving list of largely unintelligible information).
- This is an unfiltered list, so it isn’t terribly useful - other than perhaps to confirm that the connection is working!
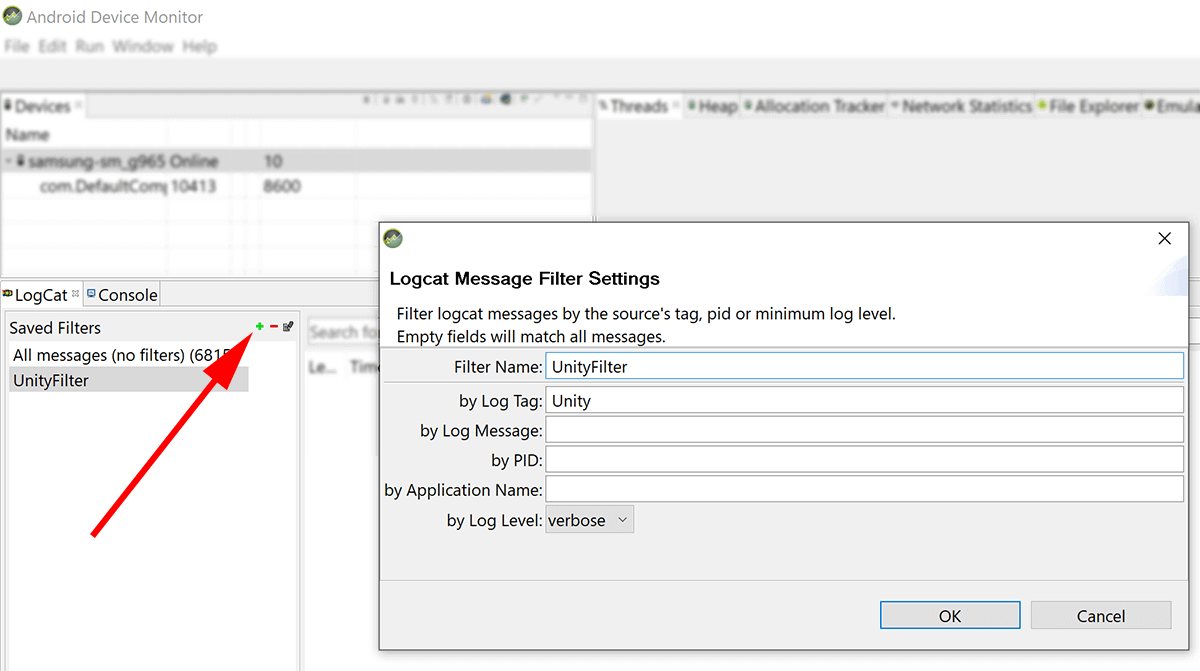
To constrain the deluge of logging down to things that apply only to our project, we need to add a filter:
- Next to the label “Saved Filter” click the small green “+” (plus) button.
- We can give the filter any name we like, but I used “UnityFilter”
- In the field “Log Tag”, add the word “Unity”
- Set a logging level appropriate to our needs (“verbose” if we want to see it all).
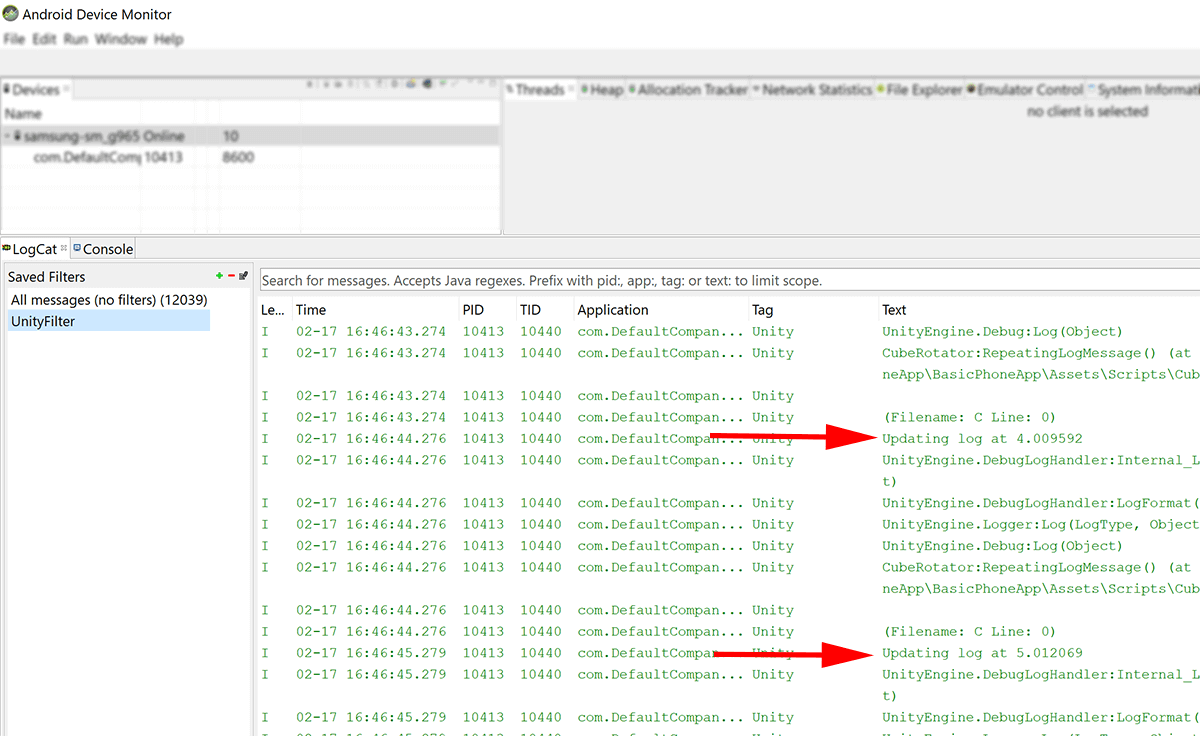
There are other ways we could filter the logging down - for example, we could identify the specific PID (program ID) - but this changes frequently as we deploy different test versions. Filtering by the tag “Unity” is a little crude, but is good enough - and reusable enough - for general use.
In the following screenshot, we can see our logging items being captured:
In the next part of this series, we look at the very basics of using Unity UI.