
In this short article, we’ll use Visual Studio to quickly attach a debugger to an application running in the Azure cloud.
Introduction
Usually, debugging our code is straightforward - we add some breakpoints, run the project locally and then work our way through identifying the thing that’s causing problems.
However, anecdotally based on conversations that I keep having with various developers, it doesn’t seem widely known that:
- we can debug our code when it’s running in Azure, just like we can locally
- … it’s really easy to do
Although it’s fair to say that we shouldn’t be attaching a debugger to a production system, debugging a version in a “test” or “staging” deployment slot may be useful when it comes to shaking-out deployment issues.
Not sure what a “Release” and “Debug” build means?
Very superficially:
- a “release” build comprises of intermediate language (IL) libraries (.dlls) that have been compiled in a way that is optimised for size and performance.
- a “debug” build isn’t intended for use in a production environment. It provides additional information that lets a debugger map the IL to our own code.
We absolutely don’t need to learn what this means in any detail - but if you are curious to learn more, have a read of Ben Hall : C# Debug vs. Release builds for an in-depth guide.
Requirements
This article is beginner friendly but it helps to have experience with the following:
- C#, .NET Core and experience working with .NET Core Web Applications.
- An account with MS Azure and experience with creating Azure resources.
We need to have created an Azure WebApp to try this experiment with. I suggest using the “F1 - Free” tier. This is a shared resource, but is more than capable for this experiment.
This article has been produced on a Windows 10 system using VS2019 Community Edition. It has not been written to provide alternative guidance for users of other OS or IDE.
Let’s do it
Firstly, we need a web application to experiment with.
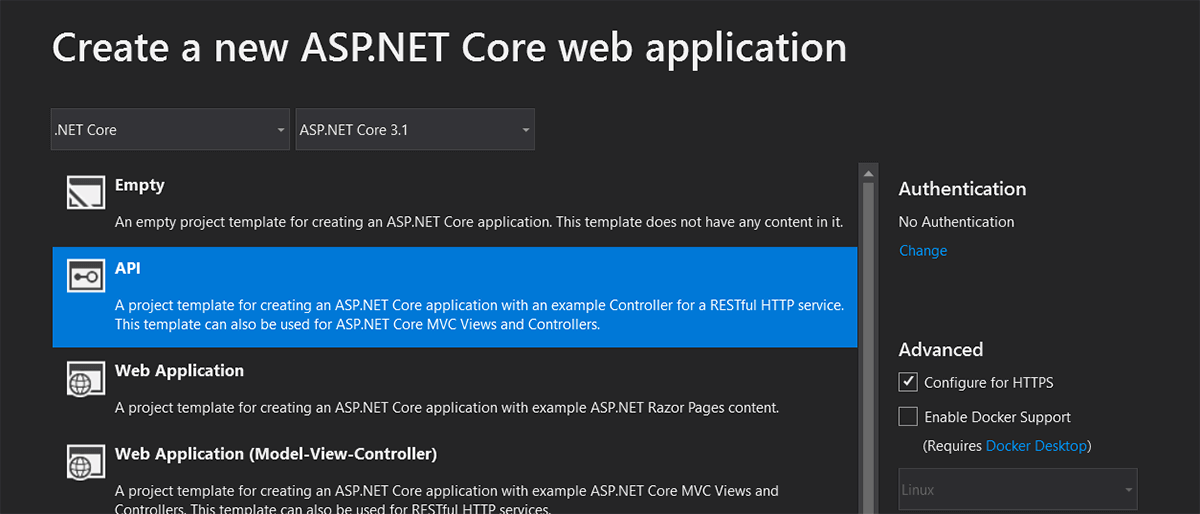
- Use Microsoft templating to create a new API ASP.NET Core 3.1 Web Application. Make sure you don’t select an “Empty” template, as we want to have scaffolded code to test with.
For the demo, we can name it anything you like and we can leave the default options selected, such as SSL support.
With the default template project created, add a breakpoint to the Get() method of Controllers/WeatherForecastController.cs
Next, we need to publish a “debug build” to our Azure WebApp (rather than default “release build”).
There are a number of ways we could go about doing this, but a quick way to demonstrate the principle is to publish directly from Visual Studio. We go about this by modifying the publish profile.
You can read more about publishing profiles here at Microsoft : Visual Studio publish profiles (.pubxml) for ASP.NET Core app deployment
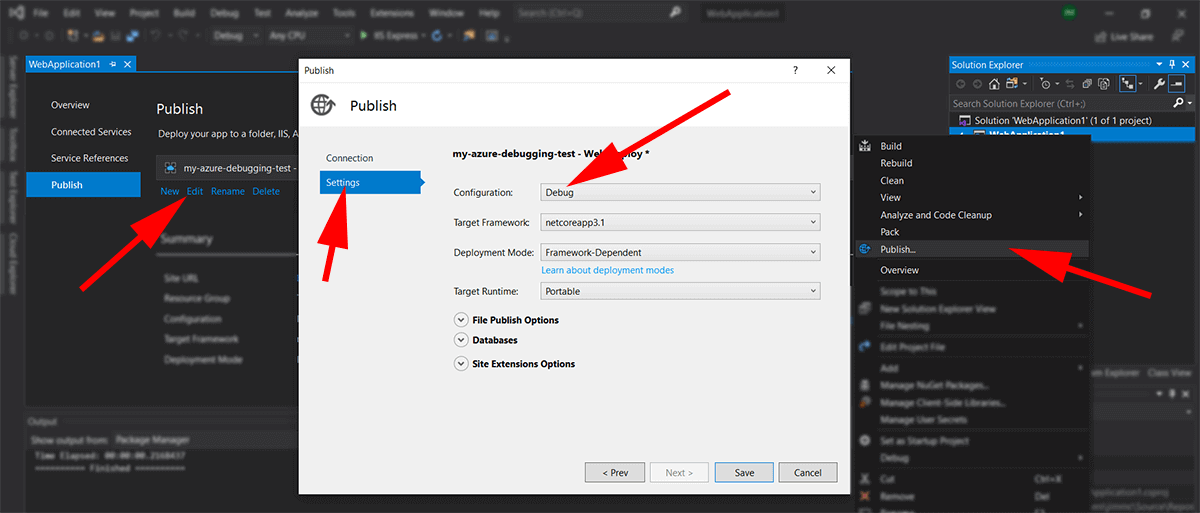
- From the Solution Explorer, right-click our WebApp project and choose “Publish”
- Assuming that you have already created a publish profile earlier, select the option “Edit” underneath the profile drop-down.
- This will bring up a modal box - change the tab on the left-side to highlight “Settings”
- In the drop-down option “Configuration”, change the setting from “Release” to “Debug”
- Save the changes to the profile.
Go ahead and publish the new build to your AppService.
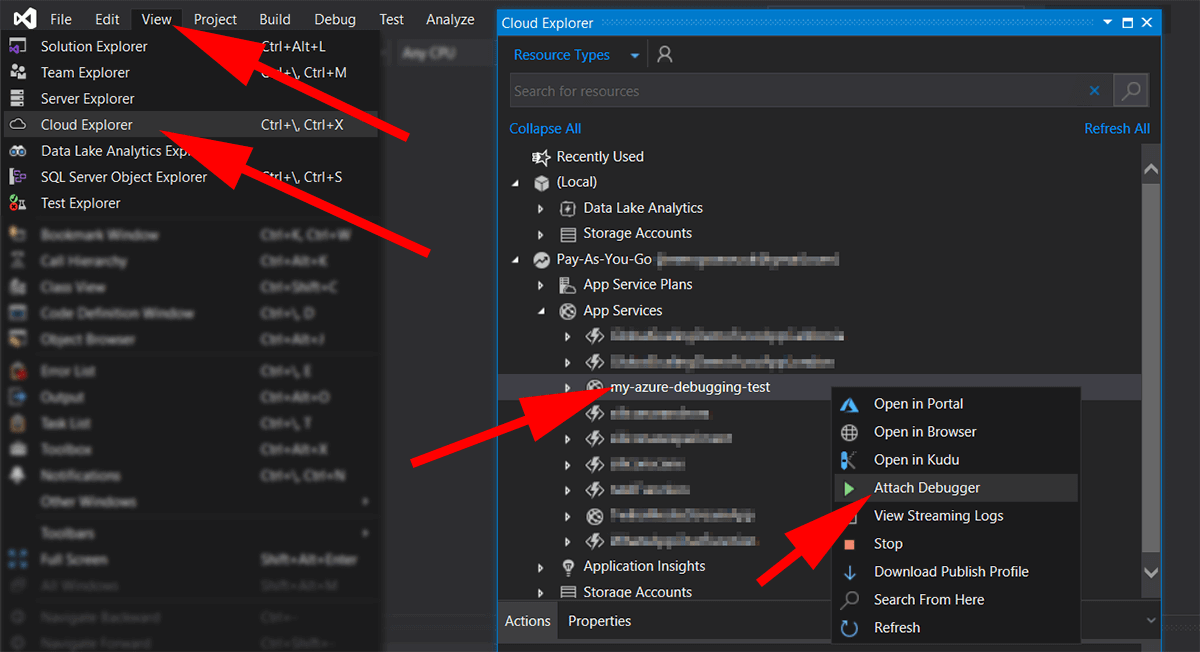
- In Visual Studio, open up the “Cloud Explorer” window.
- If you can’t see the “Cloud Explorer” window, select the “View” menu item at the top. “Cloud Explorer” is four items down by default.
- You may need to enter your Microsoft credentials that you use for Azure.
- From within “Cloud Explorer” find your subscription and expand the view using the caret.
- Locate the “App Services” section in the list and expand it using the caret.
- Find your specific AppService in the list and right-click it (in the screenshots, I’ve called it
my-azure-debugging-test) - In the list of options, you should see an option to “Attach Debugger” - go ahead and click this.
With the remote debugger attached, we can debug as if this were a local machine. We can demonstrate this working by using a browser to call data from the /api/weatherforecast API.
The only caveat with debugging remotely is that we will find the performance is a bit slower- because of the round-trip to the server and back.