
This article shows you how to run/debug your code using both Visual Studio and Visual Studio Code and with the Command Line Interface (CLI).
The first two options are code-editors that are produced by Microsoft; for those of you who might prefer to use other tools, that’s fine … the CLI is a quick way to build and run your code.
For the purpose of examples and screenshots, we’ll be using code from a project in this blog. I want to be clear that this code is not the focus of this article and that you don’t need to understand anything at all about that project, other than to know that:
a) the code compiles without problems;
b) the program will log some easily recognisable text, to the console, when you run it.
If you’re a complete beginner, you may not know how to Clone a Git repository … you can read my Beginners guide to source control and git first, which will teach you the basics.
A note on the different versions of Visual Studio.
Before we get started, we should take a moment to clarify a point that is likely to be a source of confusion for new developers. Despite sharing almost exactly the same name, “Visual Studio”, “Visual Studio Code” and “Visual Studio For Mac” are different products.
- “Visual Studio” (VS2017, at time of writing) is an Integrated Development Environment that has been around in various iterations since the late 90’s. It’s a huge suite of software that runs only on Windows. This product is available in 3 editions - “Community Edition”, “Professional Edition” and “Enterprise Edition”.
The community edition is free and will do everything you need whilst learning. The other two editions are considerably expensive and used in commercial environments.
“Visual Studio For Mac” is also a full IDE, but is not exactly the same as the Windows version, as the name might imply. Instead, it originates from a product called “Xamarin Studio” that was used to create cross-platform mobile phone apps. Xamarin is a company that Microsoft acquired and they have since set about rebranding and expanding upon the original Xamarin Studio. The upshot of this is that “Visual Studio for Mac” does not have all of the features of the Windows version.
“Visual Studio Code” (VSC) is an awesome and relatively new product (it first appeared in 2015). It is free to use and cross-platform, making it an ideal choice for coders who run MacOS or Linux. It is principally a fast and lightweight code-editor, rather than a full IDE. With that said, with the various extensions available, VSC can do a great deal more.
I want to also acknowledge “Rider” from JetBrains. Rider is a cross-platform IDE which is a strong alternative to Microsoft software. I’m hoping to revisit this blog in the future to include a section using that tool.
Prerequisites
To make use of this article, you must first have:
Installed the .Net Core Software Development Kit (SDK).
Installed either Visual Studio or Visual Studio Code - if you are intending to use either of those. If you are already using a code-editor of your preference and just want to use the CLI, you can skip this step.
Using Visual Studio
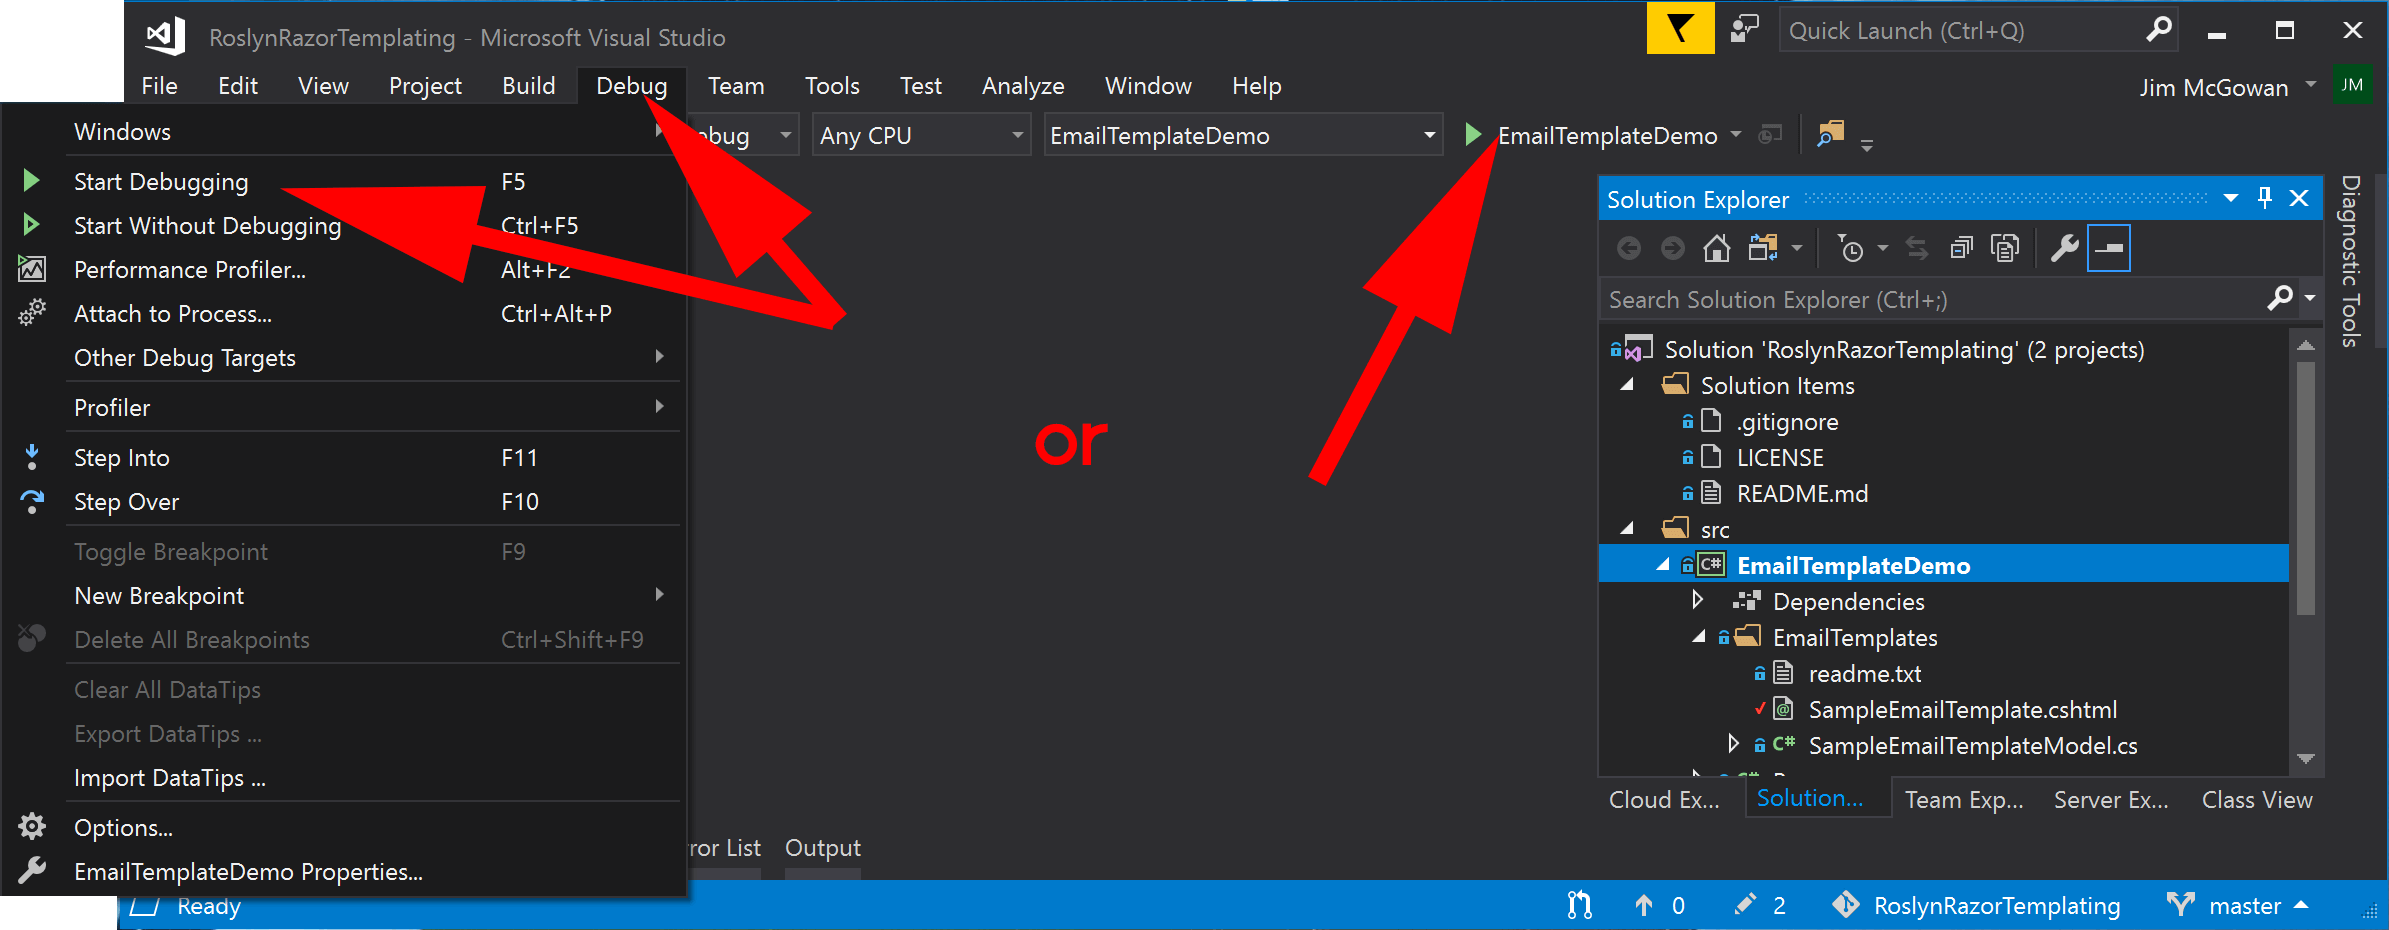
For the newbie looking at Visual Studio for the first time, its likely to be an overwhelming experience, as there are so many menus, windows and buttons. Truthfully, when you know what you are looking for, running/debugging is all integrated and it’s about as easy as you could hope for. Below are a few options:
Simply pressing
F5Selecting the
Debugmenu item, and then selectingStart DebuggingPress the debug button in the toolbar, which will show the name of the project that is selected to run.
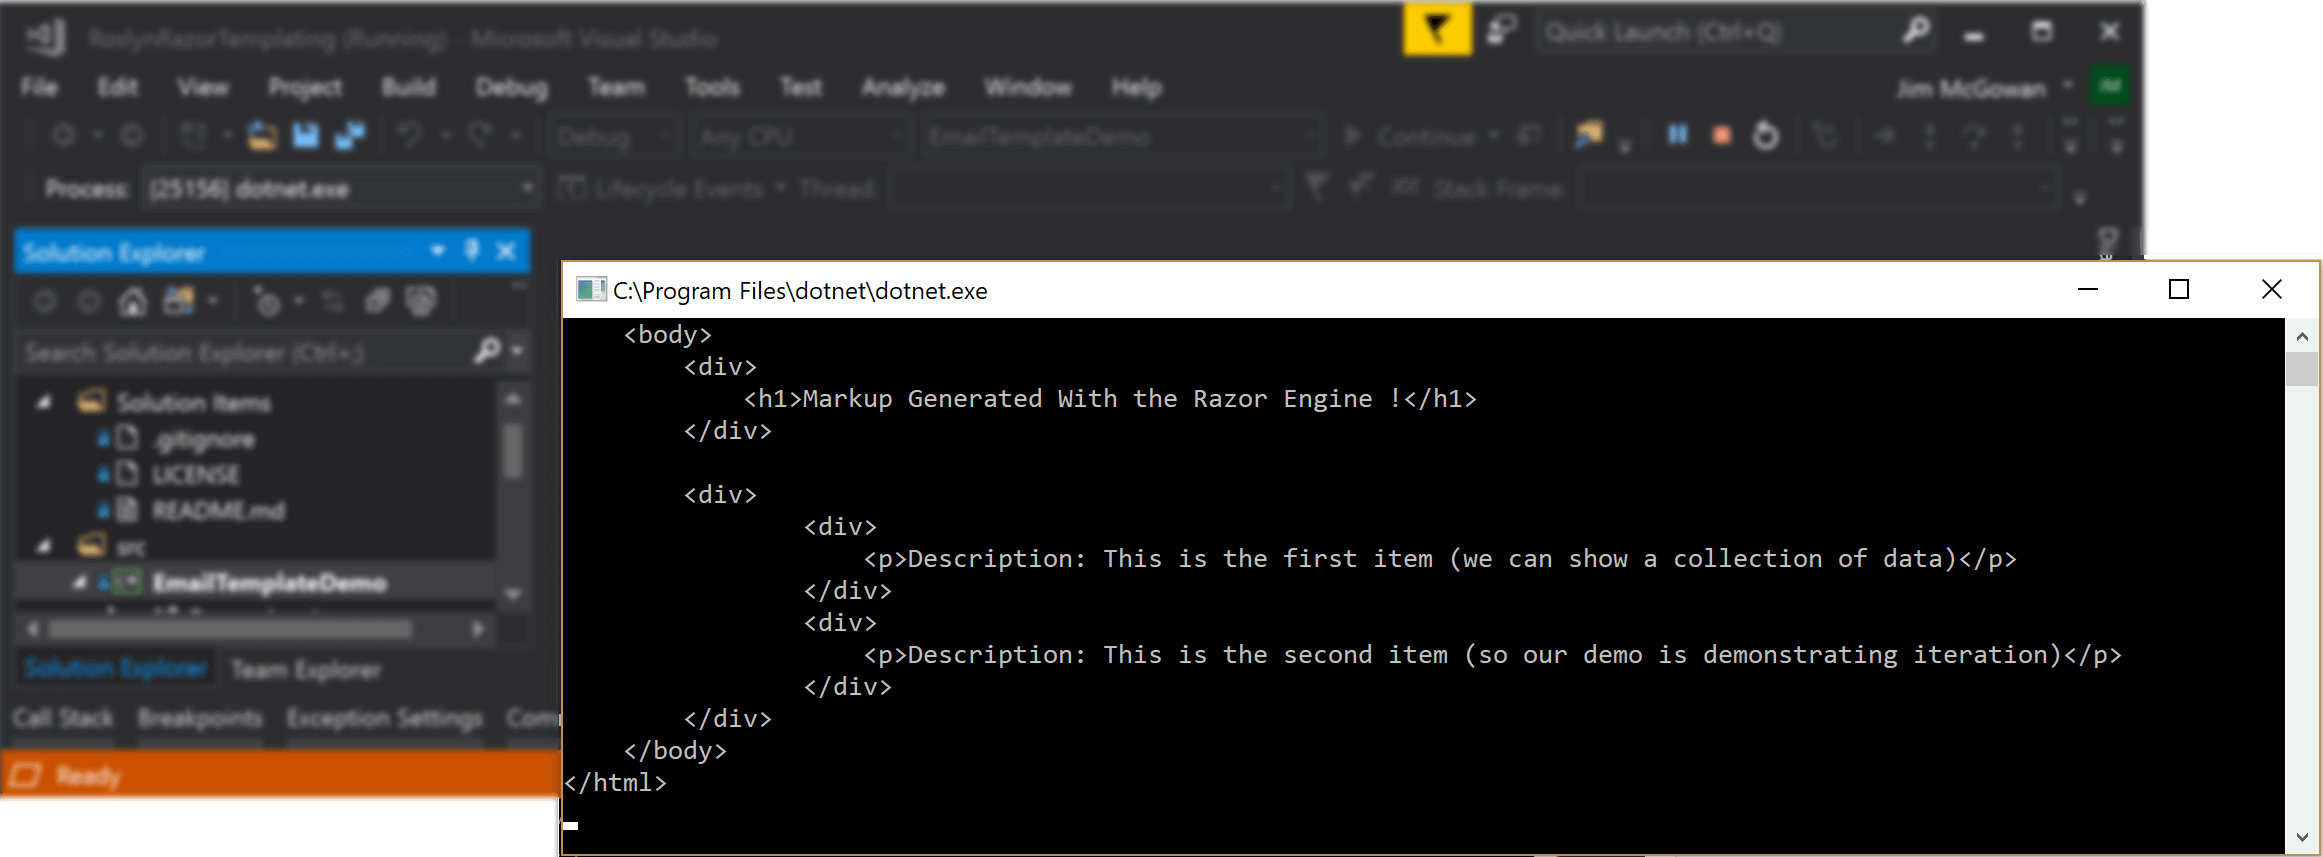
If the project is working correctly then you should see a console window open, displaying text output, like this:
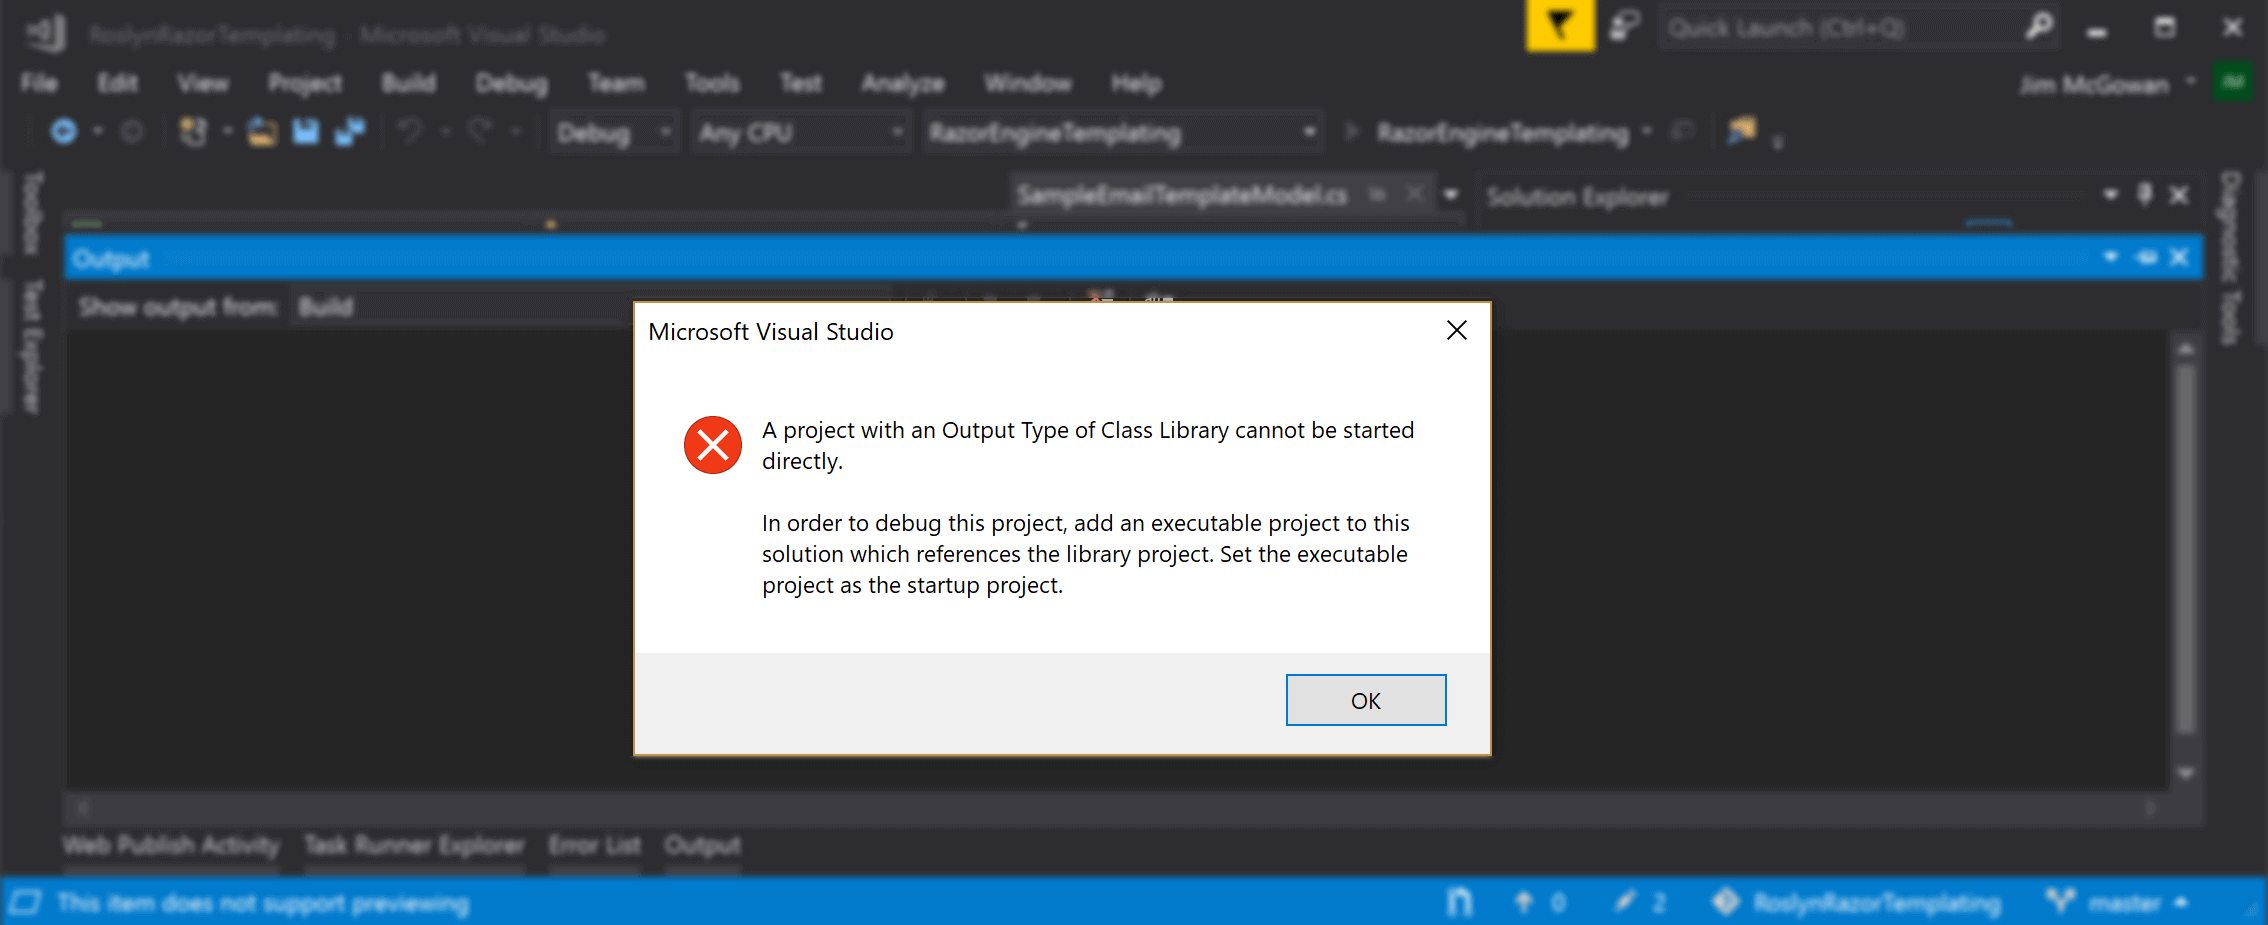
Potential Problems
If you see an error like the screenshot below, you are attempting to run a project that isn’t “runnable” - you don’t run library files directly. If this happens, you need to make sure that you have targeted the correct project as the “startup project”.
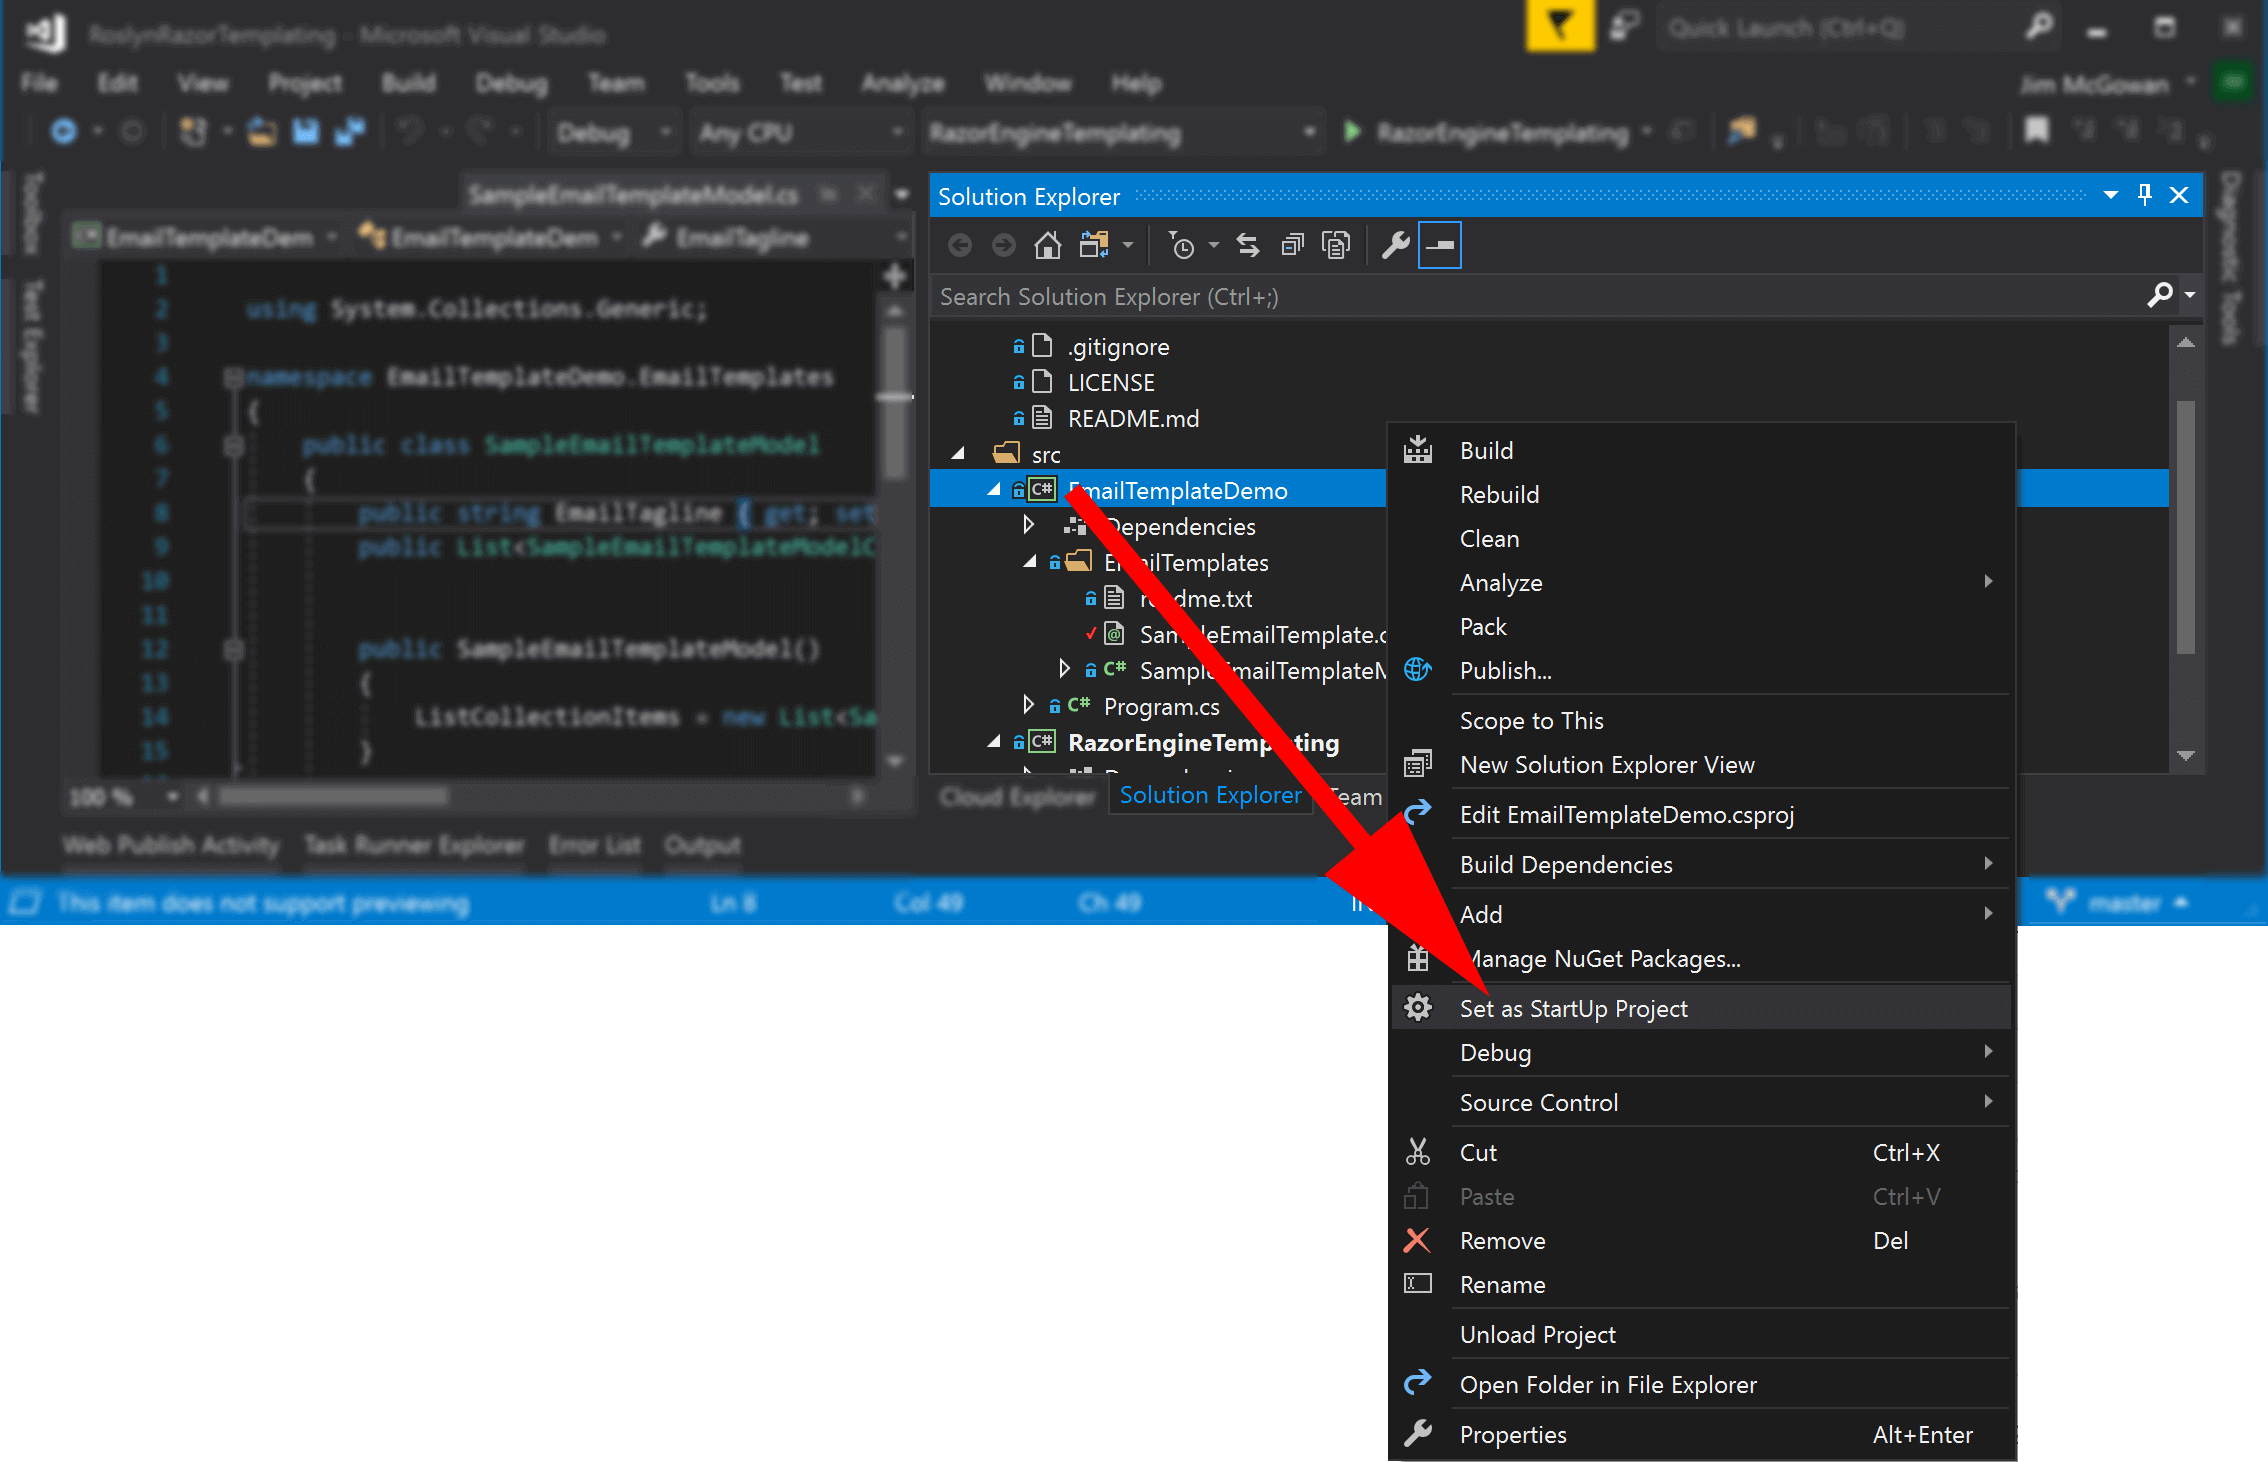
To correct the above problem, right click on the console project and select the “Set as startup project” option:
Using Visual Studio Code
Out-of-the-box, Visual Studio Code (VSC) is a text-editor, not a debugger. In this section I’ll show you how you can extend it, so you can use it as a debugger as well.
You don’t have to compile your code using VSC … you could use VSC as just an editor and use the CLI tools to build. However, being able to do everything from the same place is convenient.
VSC has been written to support extensions. These extensions add functionality, such as various tools and support for different programming languages.
Despite being a Microsoft product, out of the box, VSC doesn’t include a C# compiler extension, so it doesn’t understand what you are trying to do if you ask it to debug your code.
If you select “Start Debugging” (or more simply, just press F5) … VSC will prompt you to “select an environment”, but only lists “NodeJs” (and not .Net). This is a bit confusing if you are new and it’s not terribly clear that you need to do something to progress.
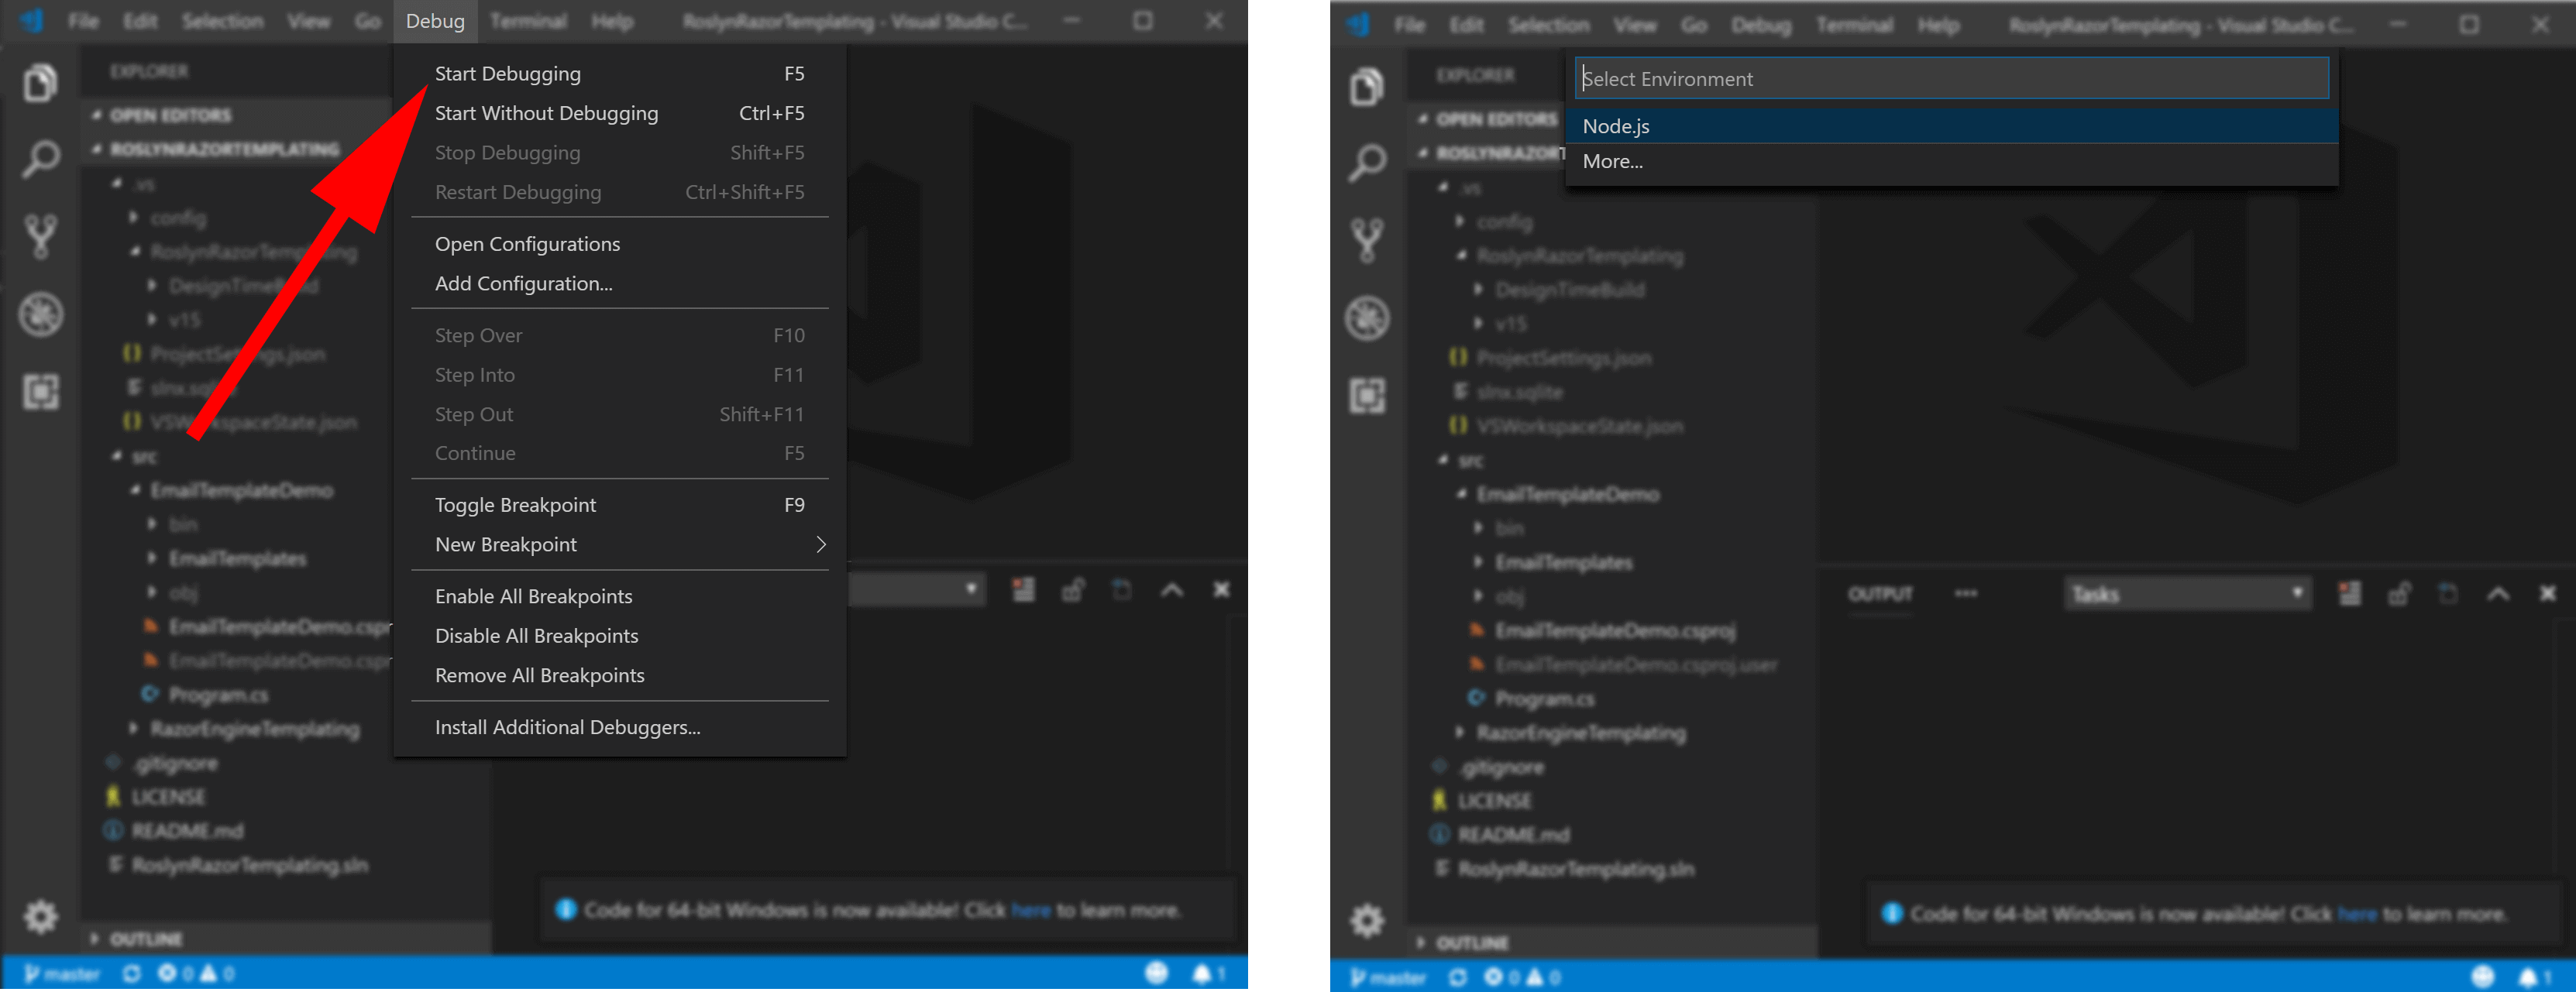
What you need to do next is press the
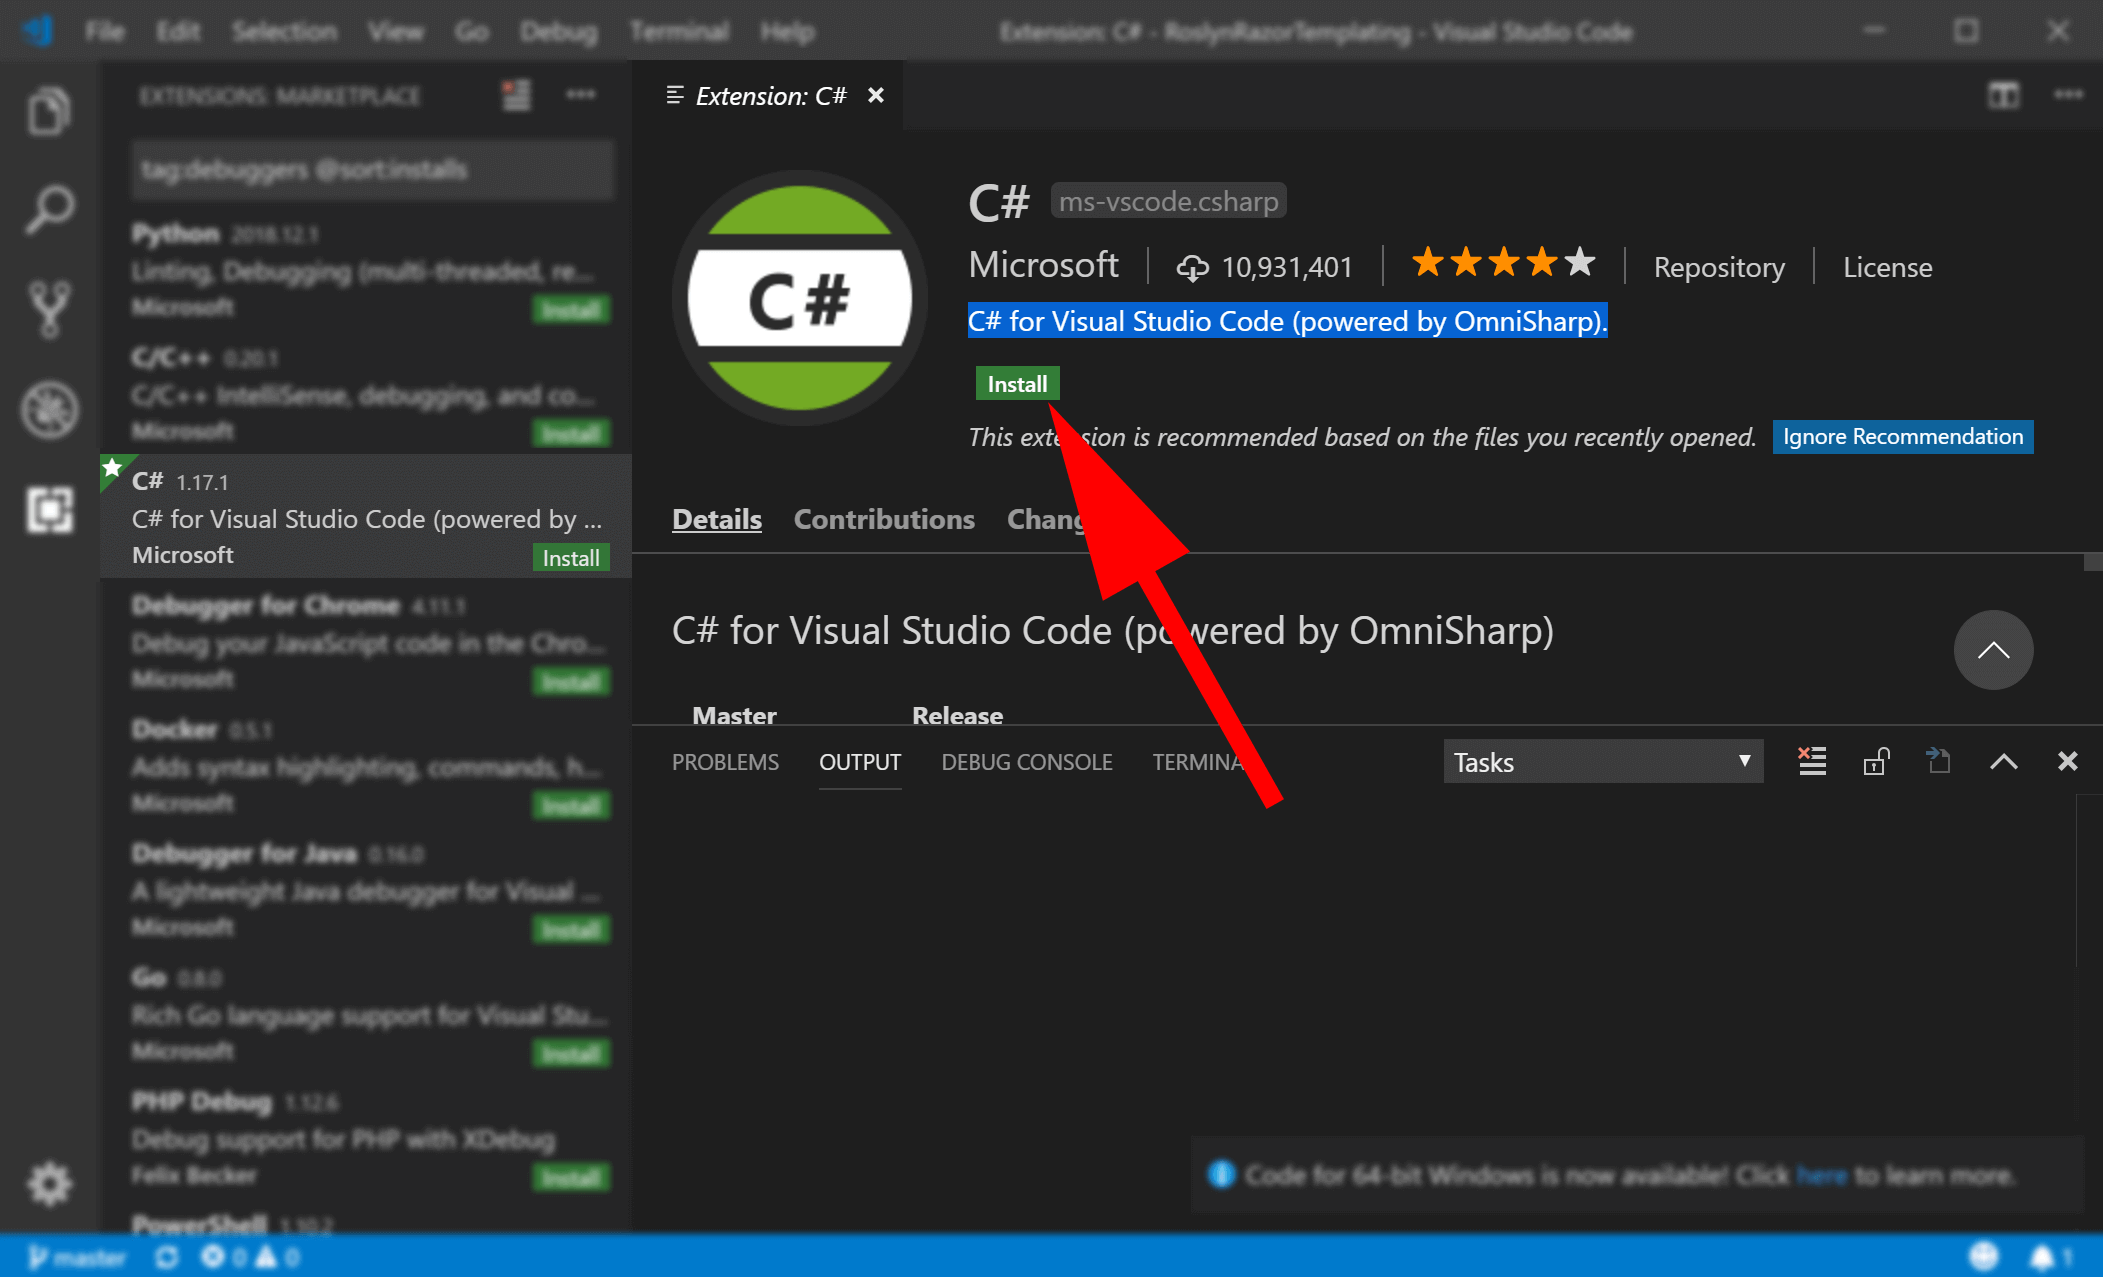
More...option that appeared (under the “select environment” filter). This will switch you over to VSC’sExtensions Marketplaceview, prefilling an appropriate search filter for you.You now want to go ahead and select the extension
C# for Visual Studio Code (powered by OmniSharp).
You’ll need to restart VSC for the extension to take effect.
Now, when you try and start the debugger, you’ll be presented with a new option of
VS Core- go ahead and select this, and the debugger will start.This is a one-off step, you won’t have to repeat the above once you’ve got the extension installed.
Potential Problems
When debugging a .Net app, the default behaviour of full Visual Studio is to open up a new console window. The default behaviour of VSC is to use a console which is integrated into VSC.
Depending on your platform and configuration, you may be presented with an alarming red error message that contains the text Cannot read keys when either application does not have a console or when console input has been redirected.
This isn’t actually a serious problem with your code, but rather an environment issue, which manifests when your code attempts to log output to the VSC integrated console.
A fix (with credit to this StackOverflow post for solution) was to:
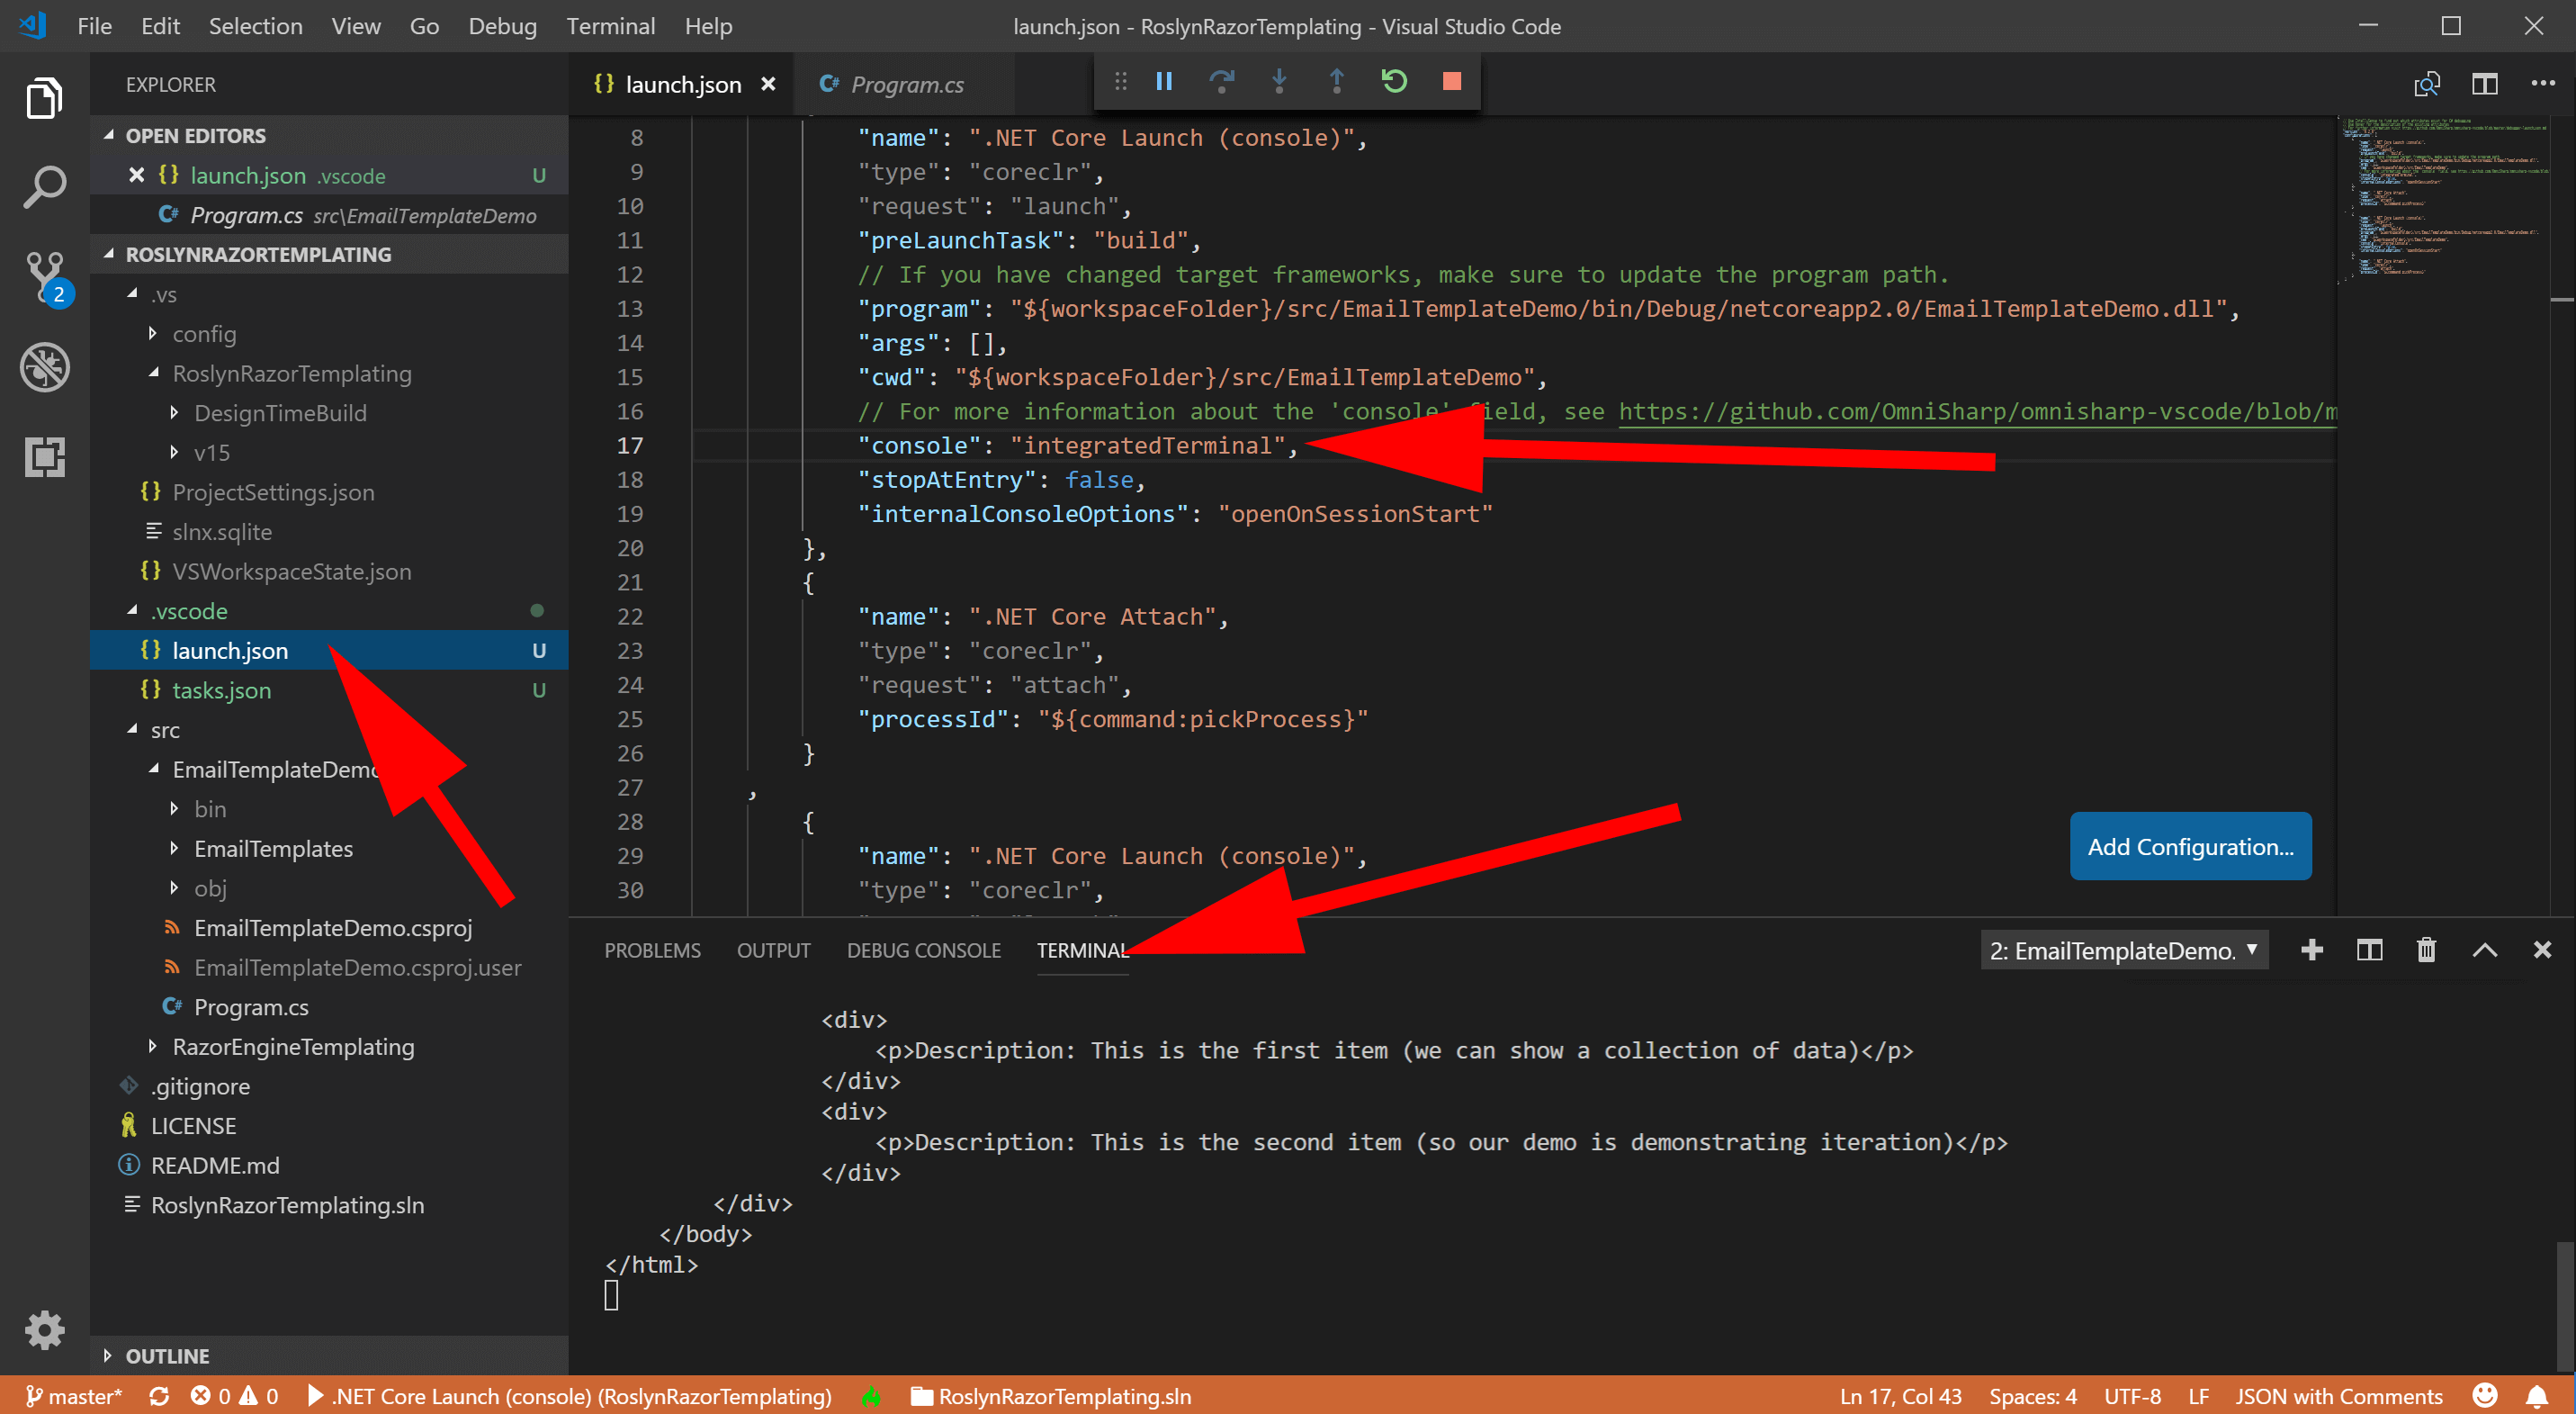
Edit the file
launch.json:Change the value of the entry
consolefrom the default value ofinternalConsoletointegratedTerminal.
With this change, debugging the code no longer throws an error.
If, once you’ve made the change, you can’t actually see the output, make sure that you are viewing the console by selecting the Terminal tab which is next to the default Debug Console tab.
“Woah, wait for a second, I can’t see the file
launch.jsonfile !?”That’s ok, these files are automatically generated by VSC the first time you try and run the project (so run the project at least once, even if it initially throws the error we talked about above)
Using the command line
Part of the appeal of .Net Core is the cross-platform support and lack of dependency on IDE’s.
If you’re following this tutorial on a Mac or Linux, using a text editor of your preference (e.g. Atom or Sublime), you’ll now be wanting to build and run the code from the command line.
The CLI is a popular option for Windows users also.
The following example assumes that your code is saved in the folder
C:\Users\<yourusername>\Source\Repos\RoslynRazorTemplatingand that we’ll be using the “emailTemplateDemo” project which is part of the “RoslynRazorTemplating” solution.
Open a new terminal/console on your computer.
At the command prompt, use the
cdcommand (change directory) to navigate to the project folder (not to the root of the solution); this will contain a.csprojfile and not the.slnsolution file.
cd \Users\<your username>\Source\Repos\RoslynRazorTemplating\src\EmailTemplateDemo
- From the command line, now enter:
dotnet build
Assuming you haven’t experienced any build problems, the code will now compile. The compiled files will be output to the .bin folder. dotnet build is used when you just want to see if your code compiles, but aren’t interested in actually executing the code to see a result.
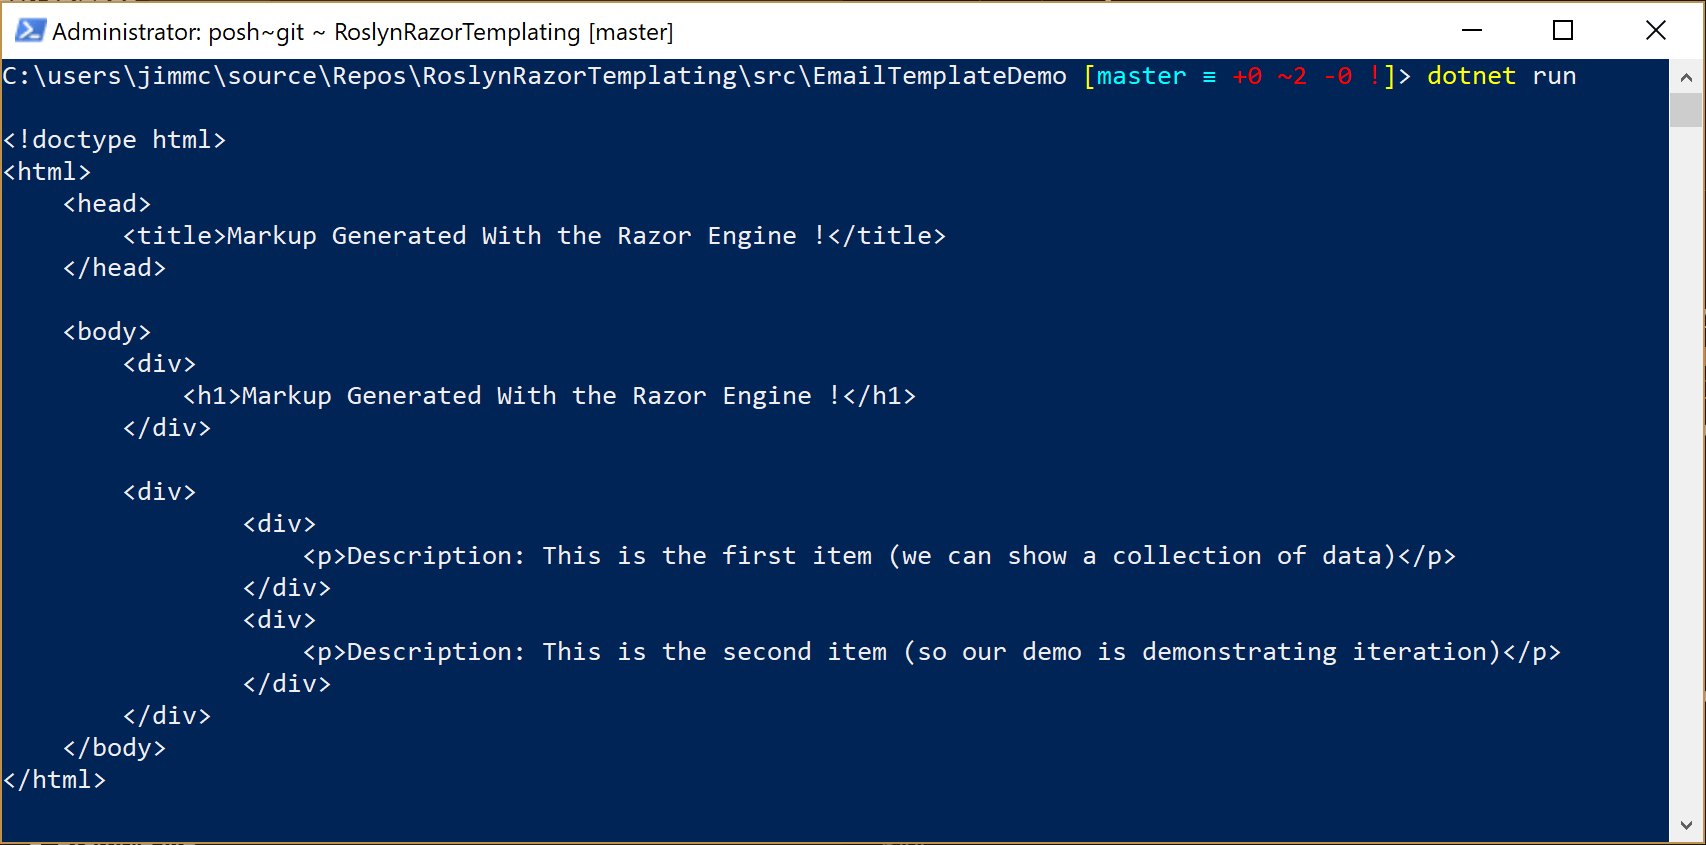
- The simple way to build and run your program is to simply enter:
dotnet run
If everything is working as expected, you should see rendered HTML outputted to the console. The output for the demo code looks like this:
- You don’t need to explicitly call
dotnet buildon your code before running it.- An important thing to learn here, is that
dotnet runis intended as a development tool: it both builds and runs your code. - A very common misunderstanding of
dotnet runis that people often assume (probably based on the name) that the command is only executing (“running”) pre-built code. As said, this is not the case -dotnet runis building and running in one step.
- An important thing to learn here, is that
You may even hear people criticise .Net Core for being slow … but this is often because they don’t realise that they’re building and executing, rather than just executing.
If you just want to execute code that has already been built, then you need to specify the .dll file which is output from the build.
- Executing pre-built code will mean that you will no longer see any apparent startup delay.
To execute pre-built code, without rebuilding, you specify compiled version (the .dll) explicitly:
- Assuming you’re still in the
EmailTemplateDemofolder, change the directory to the compiled-items folderbin\Debug(or possiblybin\Releaseif you are using the release profile). If you list the contents of this folder, you should see a number of files and folders which should include
EmailTemplateDemo.dll.Run the compiled program (the
.dll) directly:
  cd bin\Debug\netcoreapp2.0
  dotnet EmailTemplateDemo.dll
Further reading
You can learn more about .Net Core CLI commands at the Microsoft Documentation Website